 StockDrifts
The microcap trap: insider trades in thin stocks, where buying lagged and selling warned
Small companies are where insider buying is supposed to work best: fewer analysts, more for insiders to know. In ten years of Form 4 filings, the thinnest stocks were where it worked worst, where buying the dip was most often a falling knife, and where an insider sale was the clearest warning in the data. Five popular rules of thumb, tested at the end.
Insider buys, stocks under $100k a day
+9.2%
Index +13.4% · 24,566 purchases
Insider buys, $10-100M a day
+25.7%
Index +18.4% · 17,724 purchases
After insider sales, under $100k a day, 2021-25
−30.3%
Index +7.0% · typical −45.1%
Dip-buys in thin stocks 60%+ off the high
−32.4%
Typical 12-month result, excluding 2020
The reading in 30 seconds
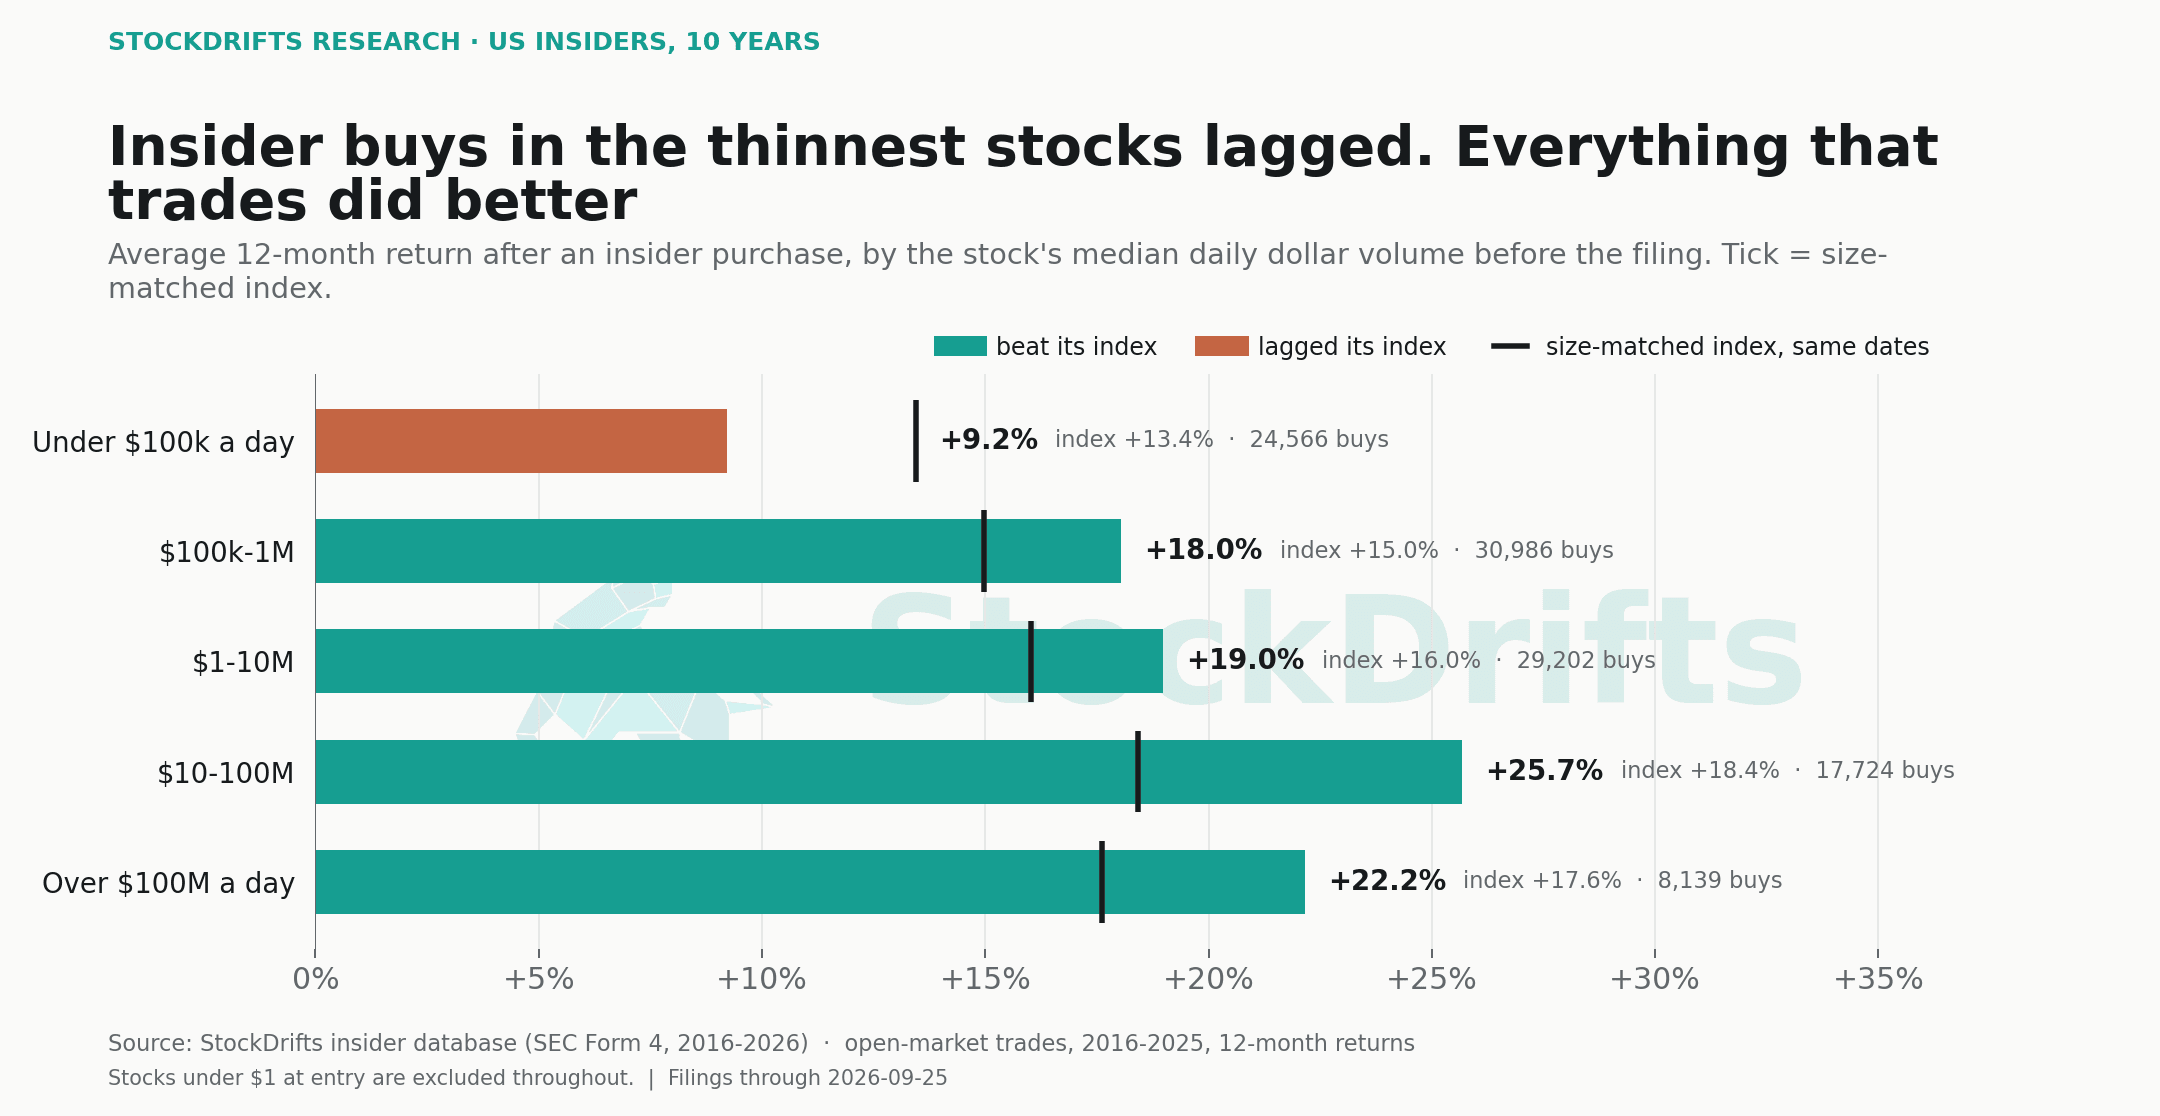
- Insider purchases in stocks trading under $100k a day returned +9.2% over the next year, against +13.4% for their index. Every more liquid band did better than its index, and stocks trading $10M to $100M a day did best: +25.7% against +18.4%.
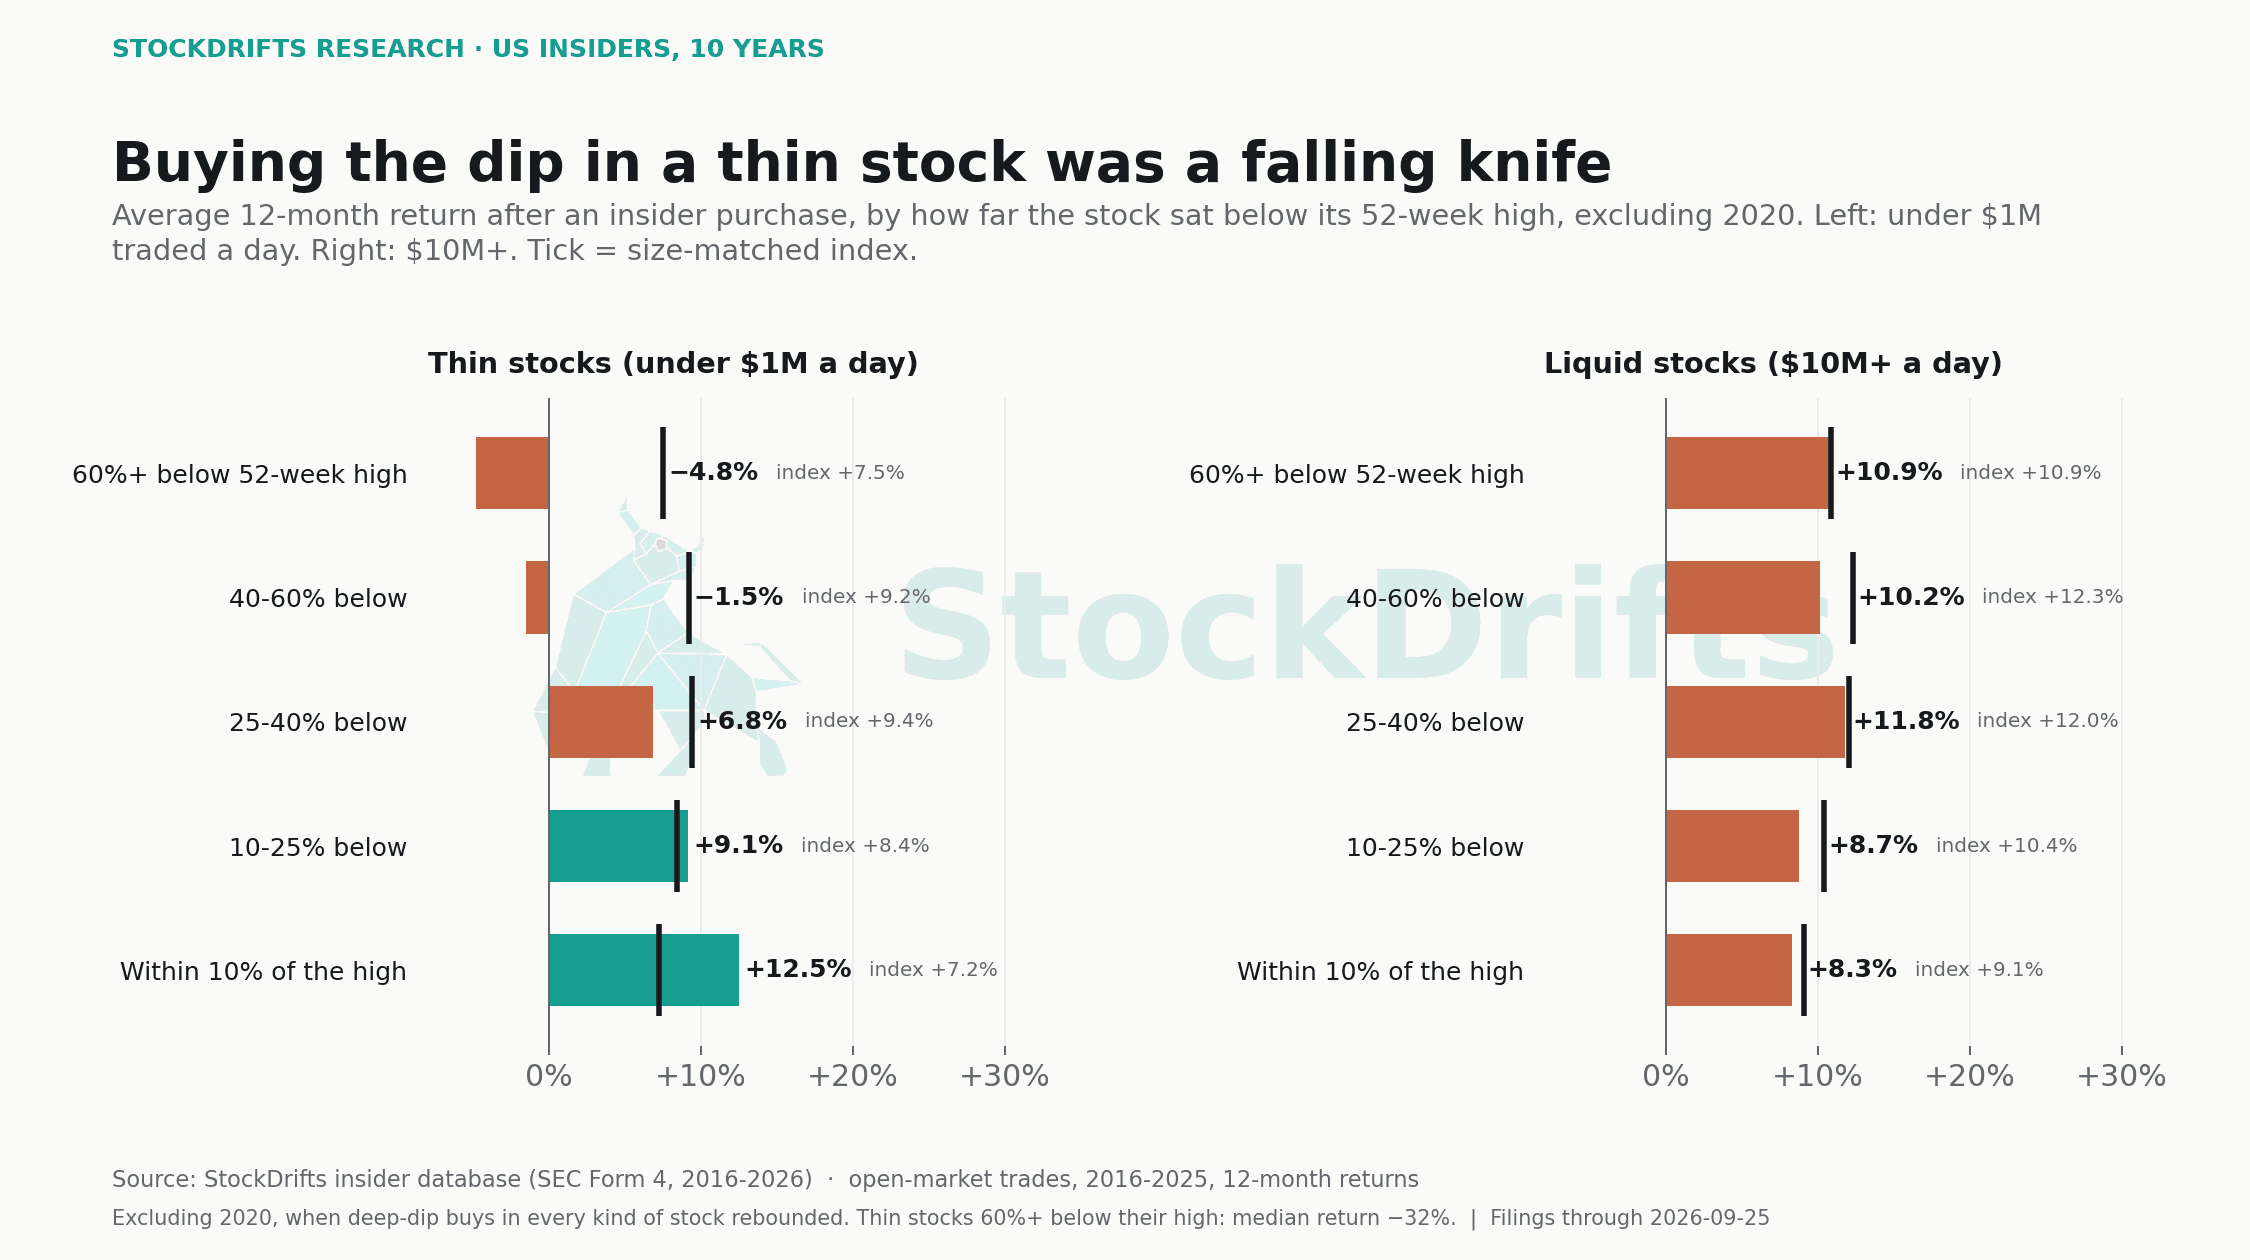
- In thin stocks, buying the dip was a falling knife: excluding 2020, insider purchases more than 60% below the 52-week high returned −4.8%, with a typical result of −32.4%. Insider purchases near the high did better than their index.
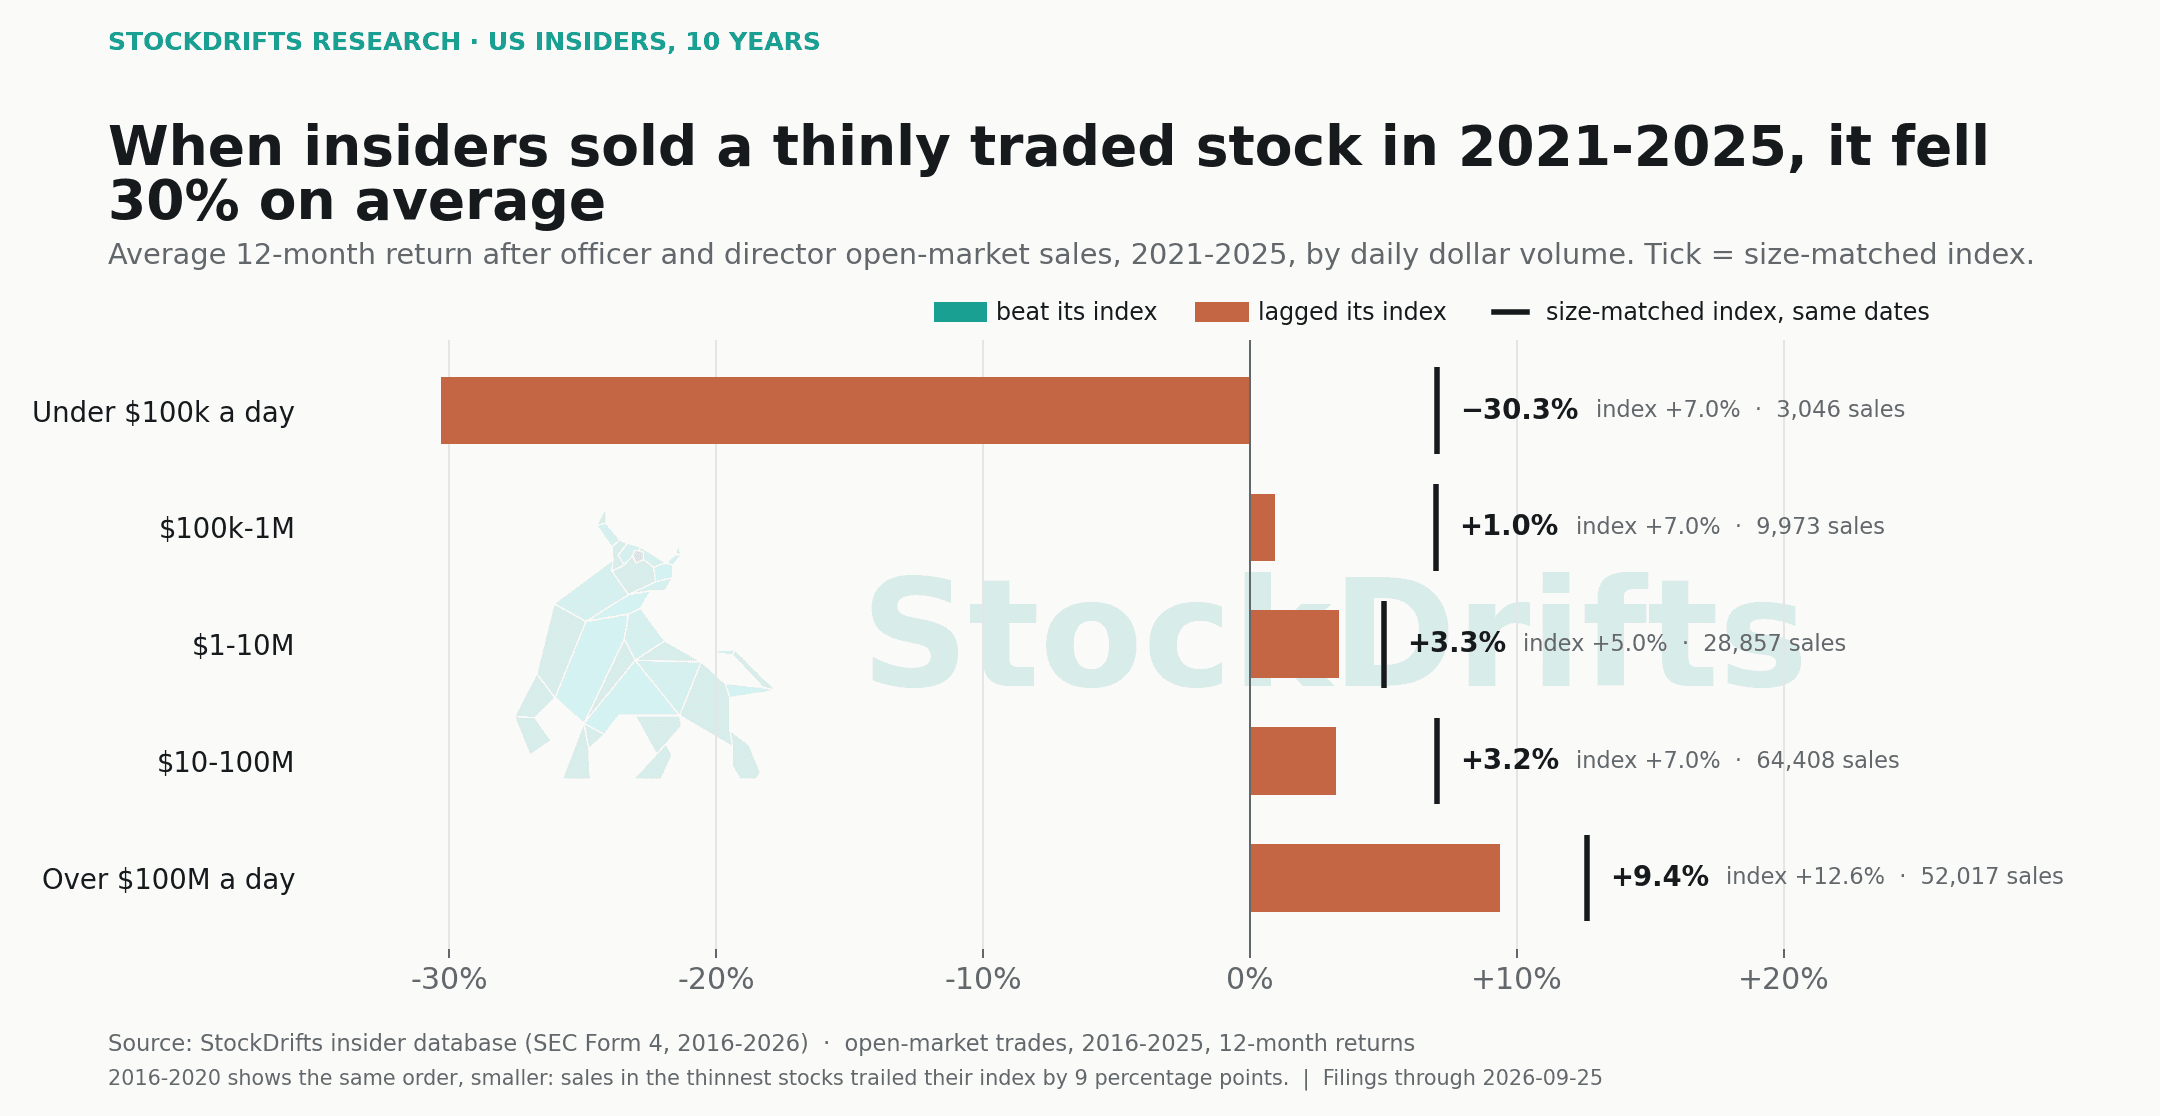
- After officers and directors sold a stock trading under $100k a day in 2021-2025, it returned −30.3% over the next year while its index returned +7.0%. Funds filing as 10% owners, purchases over $5M and first-time buyers also trailed.
01 / Liquidity
Where insider buying looked most promising, it did worst
Academic studies from the 1990s and 2000s found that insider purchases predicted returns best in the smallest companies. Many of those companies could barely be traded: a few thousand dollars of stock changing hands a day. Sort the 110,617 purchases in this study by how much of the stock traded each day, and the thinnest band is the only one that trailed its index: +9.2% against +13.4%, with a typical result of +0.1%. Stocks trading $10M to $100M a day returned +25.7% against +18.4%.
Without 2020 the more liquid bands sit close to their index and the thinnest falls further behind: +2.1% against +8.5%. The practical rule is a floor on liquidity before an insider purchase is worth a look. In the thinnest stocks a purchase is often a board supporting a company that needs support, and the stock cannot be bought or sold in size without moving it.
| Traded a day | Purchases | Average return | Index | Excl. 2020: return | Excl. 2020: index |
|---|---|---|---|---|---|
| Under $100k a day | 24,566 | +9.2% | +13.4% | +2.1% | +8.5% |
| $100k to $1M | 30,986 | +18.0% | +15.0% | +10.5% | +7.9% |
| $1M to $10M | 29,202 | +19.0% | +16.0% | +8.8% | +8.5% |
| $10M to $100M | 17,724 | +25.7% | +18.4% | +7.3% | +9.6% |
| Over $100M a day | 8,139 | +22.2% | +17.6% | +14.7% | +13.0% |
02 / Falling knives
Buying the dip in a thin stock was usually a falling knife
An insider buying after a stock has collapsed is the classic contrarian signal. It depended entirely on the stock. Excluding 2020, insider purchases in stocks trading under $1M a day that sat more than 60% below their 52-week high returned −4.8% over the next year against +7.5% for their index; the typical one lost 32%. Across all years, 34% of those purchases lost half their value within twelve months. In the same thin stocks, insider purchases within 10% of the high returned +12.5% against +7.2%: in small companies, insiders buying strength did better than insiders buying weakness.
In liquid stocks, deep-dip purchases roughly matched their index outside 2020 (+10.9% against +10.9%). In 2020 they were the best trades of the decade, because the whole market had fallen with them. A stock that falls alone usually falls for a reason.
03 / Insider selling
In thin stocks, an insider sale was the clearest warning in the data
Selling by insiders in large companies told us almost nothing: stocks trading over $100M a day returned +16.5% in the year after insider sales, against +15.3% for their index. Small companies were the opposite. After officers and directors sold a stock trading under $100k a day, it returned −11.8% over the next year against +10.8% for its index, with a typical result of −19.2%. In 2021-2025 the average was −30.3% and the typical result −45.1%; in 2016-2020, a milder +5.4% against +14.3%.
The size of the sale did not change the message. In stocks trading under $1M a day, sales of less than 10% of the insider's holding were followed by +2.8% against +10.7%, and sales of more than half by +3.2% against +10.7%. For a shareholder in a small company, a Form 4 sale from its officers is a reason to re-read the last quarterly filing.
| Traded a day | 2016-20: return | 2016-20: index | 2021-25: return | 2021-25: index | 2021-25: sales |
|---|---|---|---|---|---|
| Under $100k a day | +5.4% | +14.3% | −30.3% | +7.0% | 3,046 |
| $100k to $1M | +15.8% | +13.9% | +1.0% | +7.0% | 9,973 |
| $1M to $10M | +19.8% | +14.7% | +3.3% | +5.0% | 28,857 |
| $10M to $100M | +21.0% | +15.4% | +3.2% | +7.0% | 64,408 |
| Over $100M a day | +25.2% | +18.5% | +9.4% | +12.6% | 52,017 |
04 / Rules of thumb
Five rules, tested
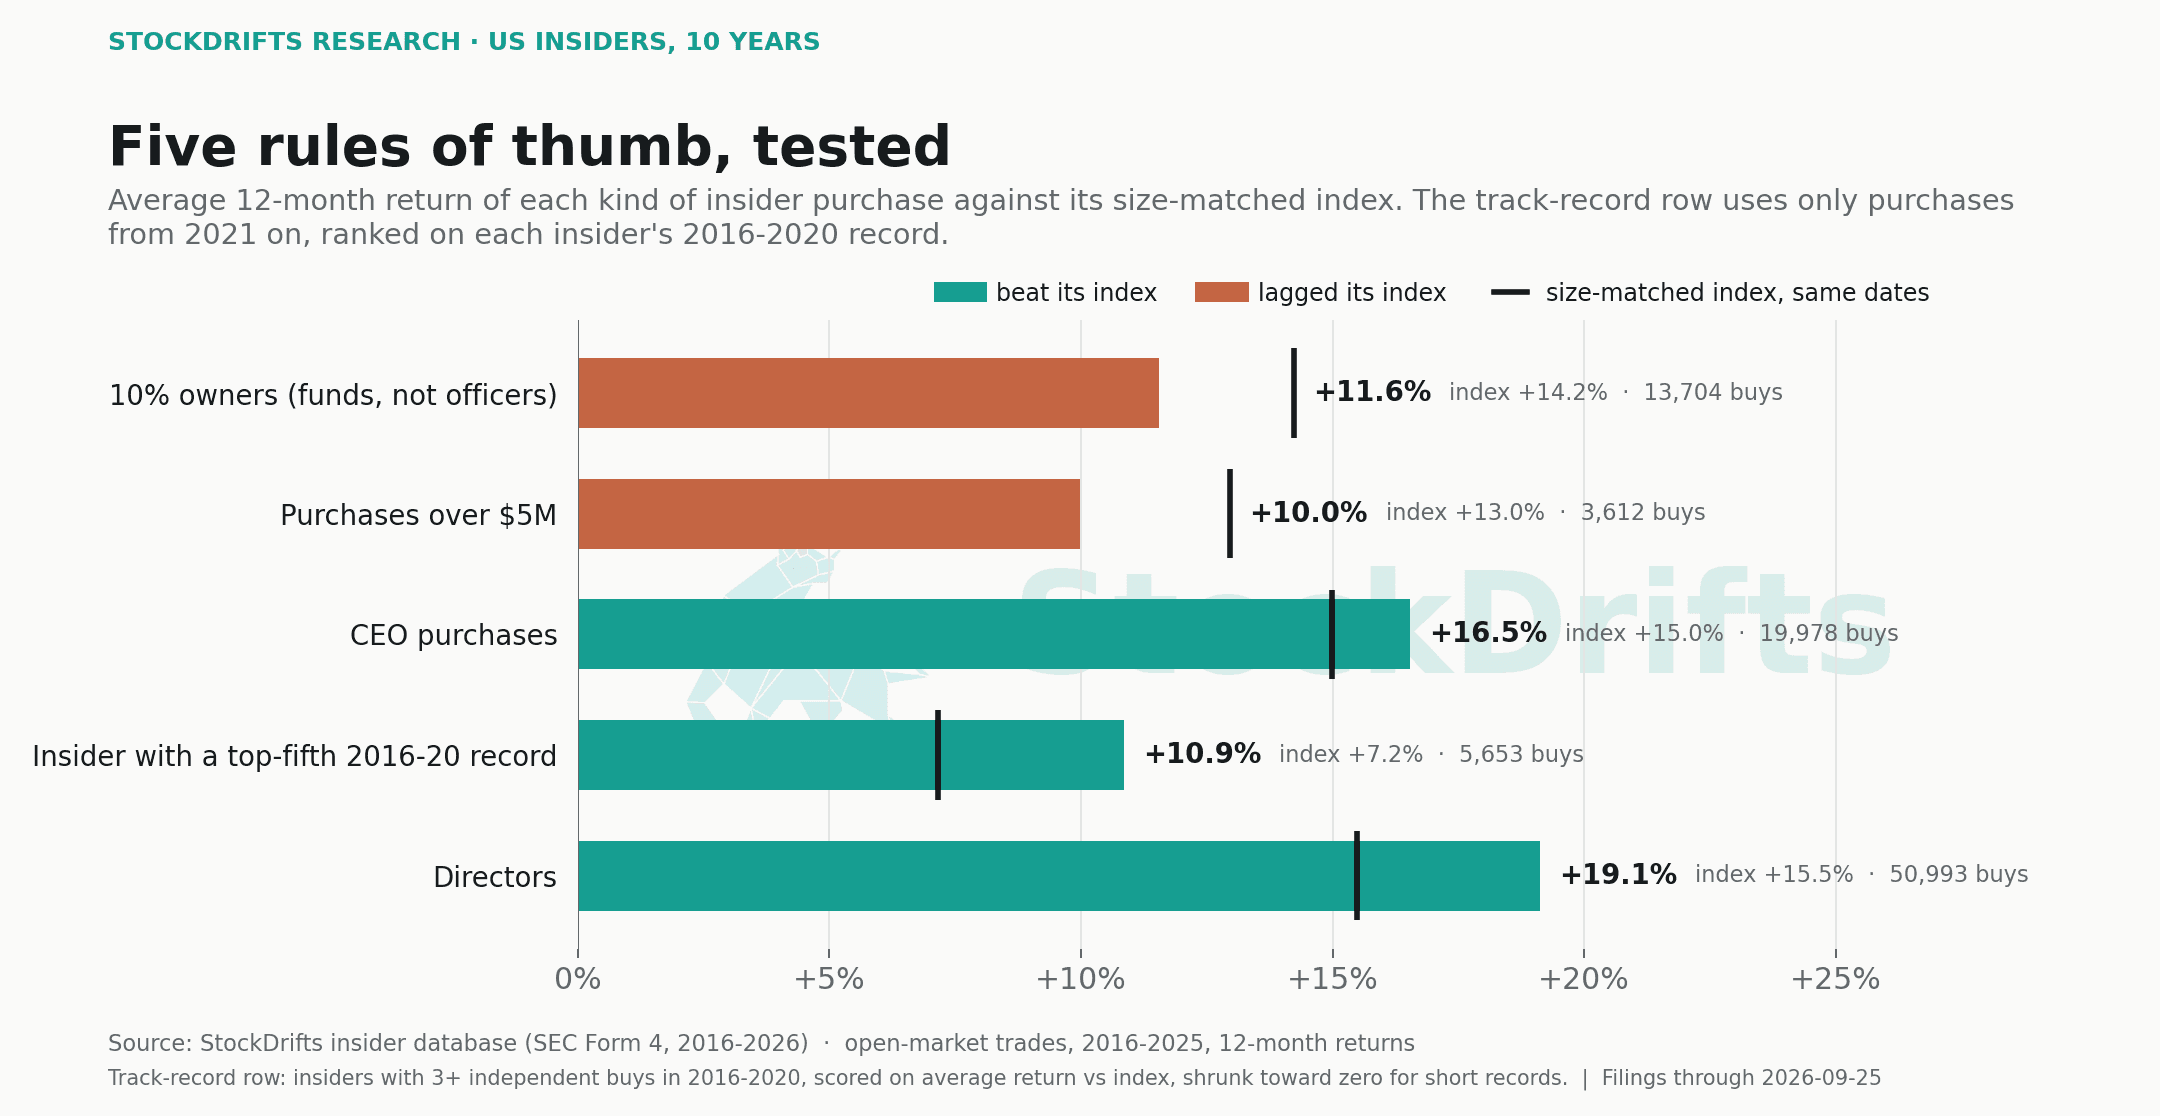
"Follow the funds that own 10%." Did not pay. Purchases by holders filing only as 10% owners returned +11.6% against +14.2%. Many are private placements and financing rounds, bought at negotiated prices.
"The bigger the purchase, the stronger the signal." Did not pay. Purchases over $5M returned +10.0% against +13.0%; purchases under $250k beat their index. For CEOs, the share of the stake is the measure that works.
"Follow the CEO." Weaker than following the board. CEO purchases returned +16.5% against +15.0%, directors' purchases +19.1% against +15.5%.
"Follow insiders with a great record." Partly. We scored every insider with three or more purchases in 2016-2020 and followed their purchases from 2021. The top fifth returned +10.9% against +7.2%, but the bottom fifth also beat its index (+5.8% against +3.1%), and the top fifth's typical purchase returned −0.3%. The clearer split was experience: insiders with no purchases in 2016-2020 returned +4.6% against +7.9% on their later ones. A record mostly says an insider has bought before; it did not make the next purchase more likely to work.
"Plan purchases don't count." They behaved like any other. Purchases flagged as 10b5-1 plan trades returned +17.8% against +14.7%; discretionary purchases +17.5% against +15.5%.
| 2016-2020 record | Later purchases | Average return | Index | Typical (median) |
|---|---|---|---|---|
| bottom fifth | 4,049 | +5.8% | +3.1% | +1.0% |
| second | 5,629 | +8.6% | +7.5% | +7.1% |
| middle | 2,818 | +6.8% | +5.6% | +3.3% |
| fourth | 2,319 | +4.6% | +6.3% | +1.8% |
| top fifth | 5,653 | +10.9% | +7.2% | −0.3% |
| no 2016-2020 purchases | 32,216 | +4.6% | +7.9% | −1.6% |
05 / The checklist
Before following an insider into a small company
1. Check what trades. Under $100k a day, insider purchases trailed their index; set a floor before reading further.
2. Check the chart. In thin stocks, insiders buying 60% below the high was usually a falling knife. Insiders buying near the high did better.
3. Check who is buying. Directors and officers with a buying history, not funds filing as 10% owners or first-time buyers.
4. Check the market. Deep-dip purchases paid when the whole market had fallen, as in 2020. The insider buy/sell ratio shows when that is happening.
5. Respect the sale. If officers of a small company you own are selling, find out why before the next twelve months do. The full picture is in the ten-year study.
06 / Explore the evidence
Download the tables
07 / Questions
Questions this study answers
- Is insider selling a bad sign?
- In large, liquid companies, usually not: after officers and directors sold stocks trading over $100M a day, those stocks returned +16.5% over the next year against +15.3% for their index. In thinly traded companies, yes. After insider sales in stocks trading under $100k a day, the stock returned −11.8% on average against +10.8%, and in 2021-2025 −30.3% against +7.0%.
- What does insider selling mean?
- Most insider selling is compensation being turned into cash: executives are paid in stock and sell on schedules, often through 10b5-1 plans set up months ahead. That is why selling in large companies says little. Since April 2023, when Form 4 gained a 10b5-1 checkbox, plan sales returned +19.6% over the next year against +17.4% for their index, and discretionary sales +17.3% against +16.8%. A sale by the officers or directors of a small, thinly traded company is rarer and, in our data, was followed by large declines.
- Should I buy a stock after insiders buy the dip?
- Only if the stock trades. Excluding 2020, when every kind of dip-buy rebounded, insider purchases in stocks trading under $1M a day that sat more than 60% below their 52-week high returned −4.8% over the next year against +7.5% for their index, with a typical result of −32.4%. In stocks trading $10M or more a day, the same purchases roughly matched their index (+10.9% against +10.9%).
- Does insider buying work in small caps and microcaps?
- Not in the thinnest stocks. Insider purchases in stocks trading under $100k a day returned +9.2% on average over the next year against +13.4% for a size-matched index, while purchases in stocks trading $10M to $100M a day returned +25.7% against +18.4%. The older academic finding that insider buying works best in small companies does not survive once you require that the stock can actually be bought.
This study describes past trades and what their stocks did afterwards. It is not a recommendation to buy or sell any security. Averages over thousands of trades say nothing certain about the next one, and the trades named here are examples, not picks.
More in this series
- Ten years of insider buying: what 113,117 Form 4 purchases returned, and where the returns came fromOriginal Research · September 29, 2026
- When CEOs bet big on their own stock: liquid names paid, thin ones did notOriginal Research · September 29, 2026
- Cluster buying: what happened when several insiders bought the same stockOriginal Research · September 29, 2026
- The insider buy/sell ratio: the weeks insiders called the market, and the crashes they missedOriginal Research · September 29, 2026