 StockDrifts
After the weeks US insiders bought most, the S&P 500 returned +24.1% the next year
Every week we count how many company insiders filed purchases and how many filed sales. Most weeks sellers outnumber buyers three or four to one. A few times a year the balance swings, and those weeks have been good times to own the index. The signal has two blind spots, and it says nothing about which stocks to buy.
S&P 500, 12 months after a buying spree
+24.1%
After other weeks +15.4% · 39 spree weeks
Spree weeks followed by a gain
95%
Other weeks 86%
Same, excluding 2020
+18.1%
After other weeks +13.5% · 33 spree weeks
This week's ratio
0.40
Week to September 25 · 148 buyers, 366 sellers
The reading in 30 seconds
- In the 39 spree weeks since 2017, the S&P 500 returned +24.1% over the following year and the Russell 2000 +23.7%, against +15.4% and +11.4% after other weeks. Without 2020 the spree weeks still led: +18.1% against +13.5%.
- It is a market signal, not a stock list. Outside 2020, the stocks insiders bought during spree weeks returned +5.9% against +10.9% for their index.
- Insiders cannot buy during earnings blackouts. The April 2025 tariff selloff and the July 2026 chip selloff both landed in those weeks, and the ratio stayed quiet. This week it stands at 0.40, higher than 95% of weeks since 2024.
01 / The measure
Insiders sell every week. The information is in when they buy
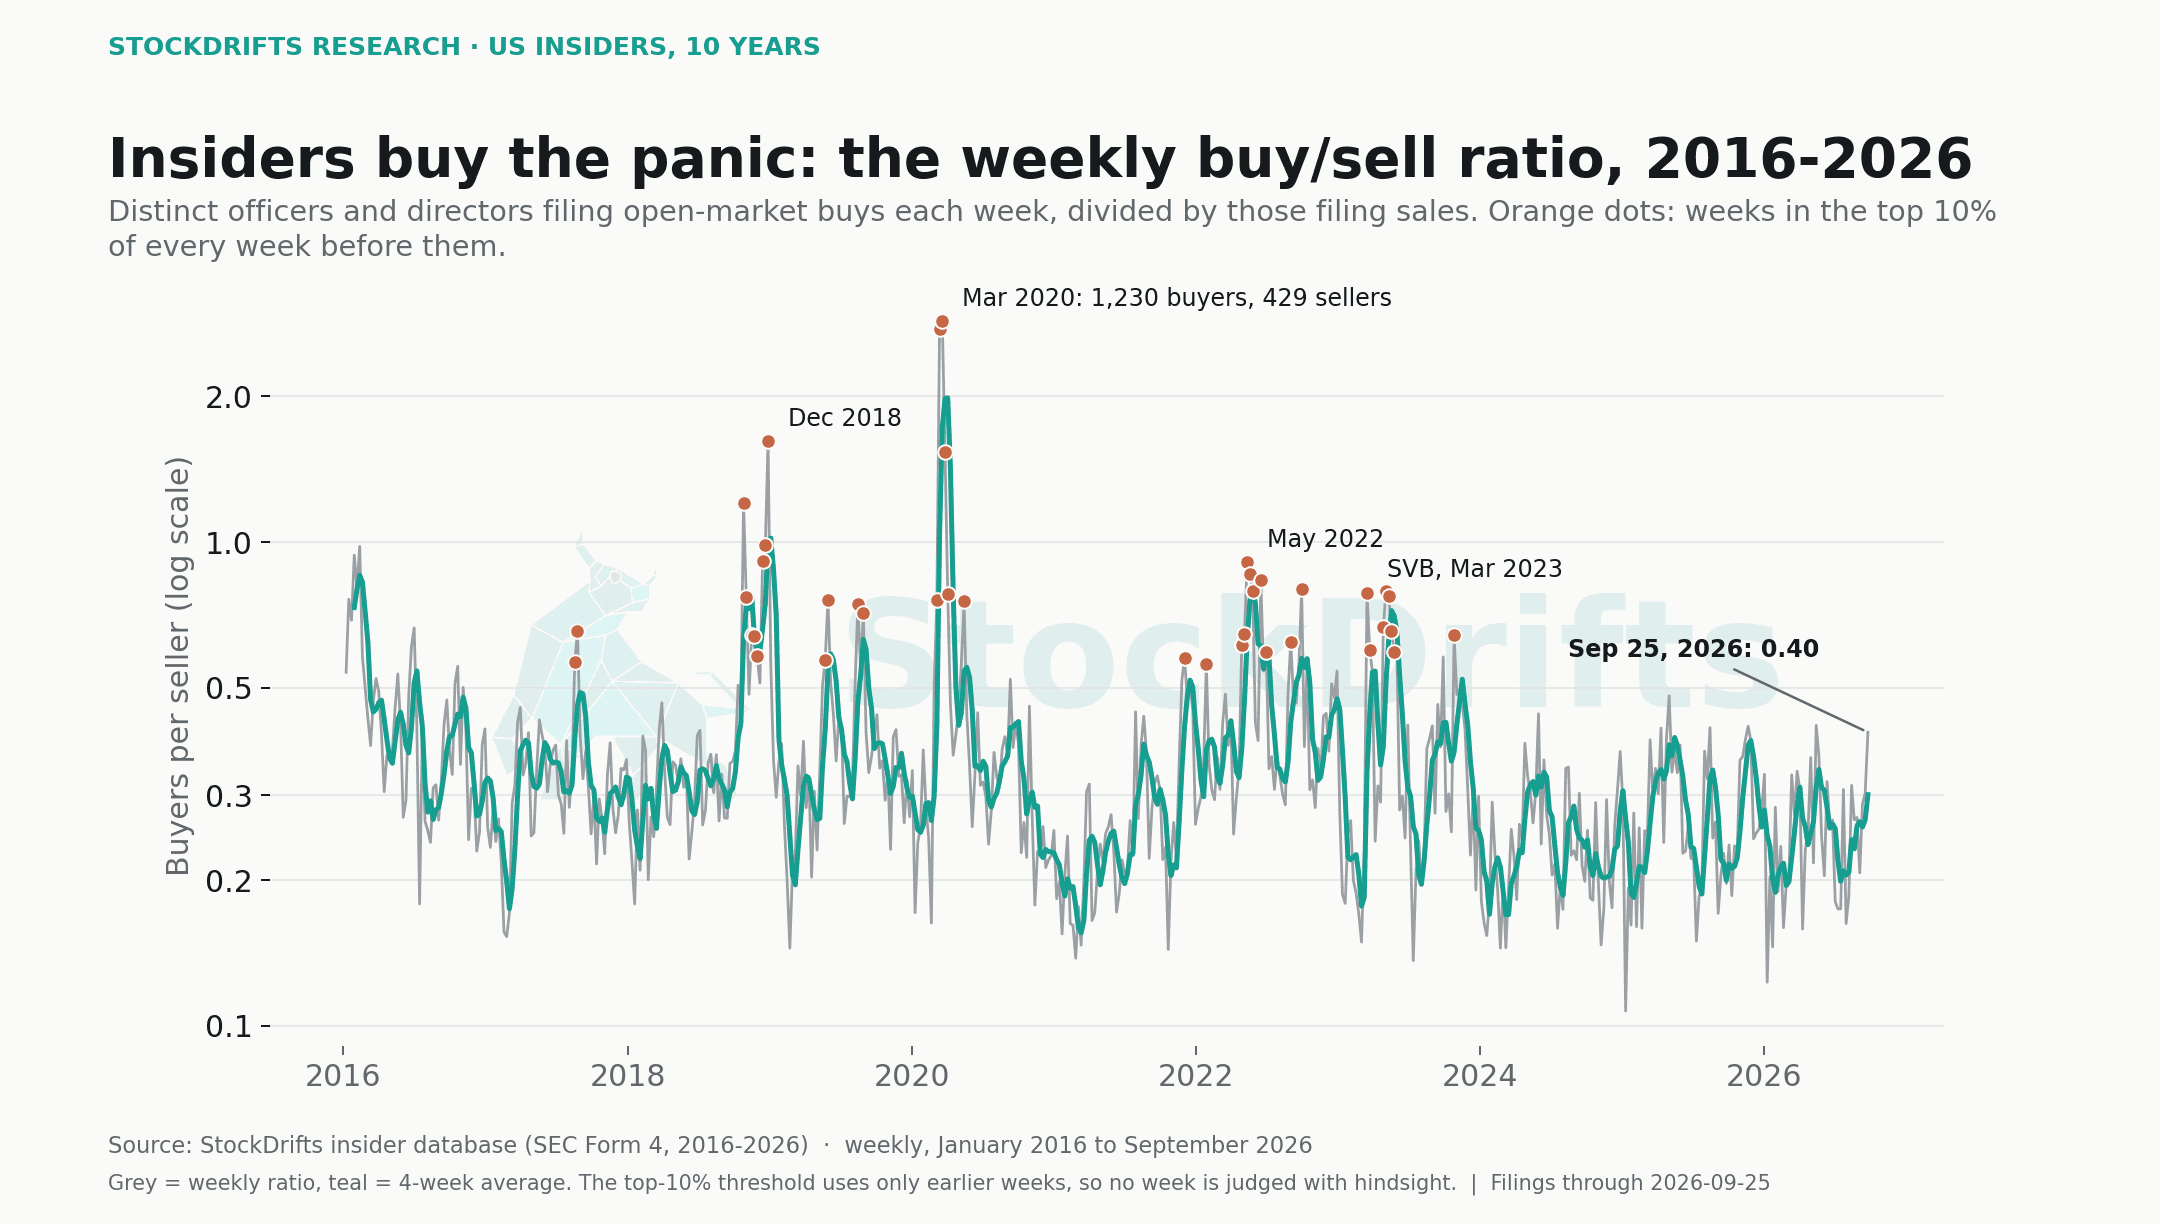
Officers and directors sell far more often than they buy: much of their pay arrives in stock, and selling it is routine. The weekly ratio of buyers to sellers has averaged 0.35 since 2016. It moves when insiders across hundreds of unrelated companies decide at the same moment that their own shares are cheap. In the week to March 13, 2020, 1,346 insiders filed purchases and 488 filed sales: that week and the next were the only two in the decade when buyers outnumbered sellers nearly three to one.
We count people rather than dollars so that a single fund's block purchase or a founder's large sale cannot move the measure. A spree week is one whose ratio sits in the top 10% of every week that came before it, which means each week is judged only on what was known at the time.
02 / What followed
The index did best after the weeks insiders bought most
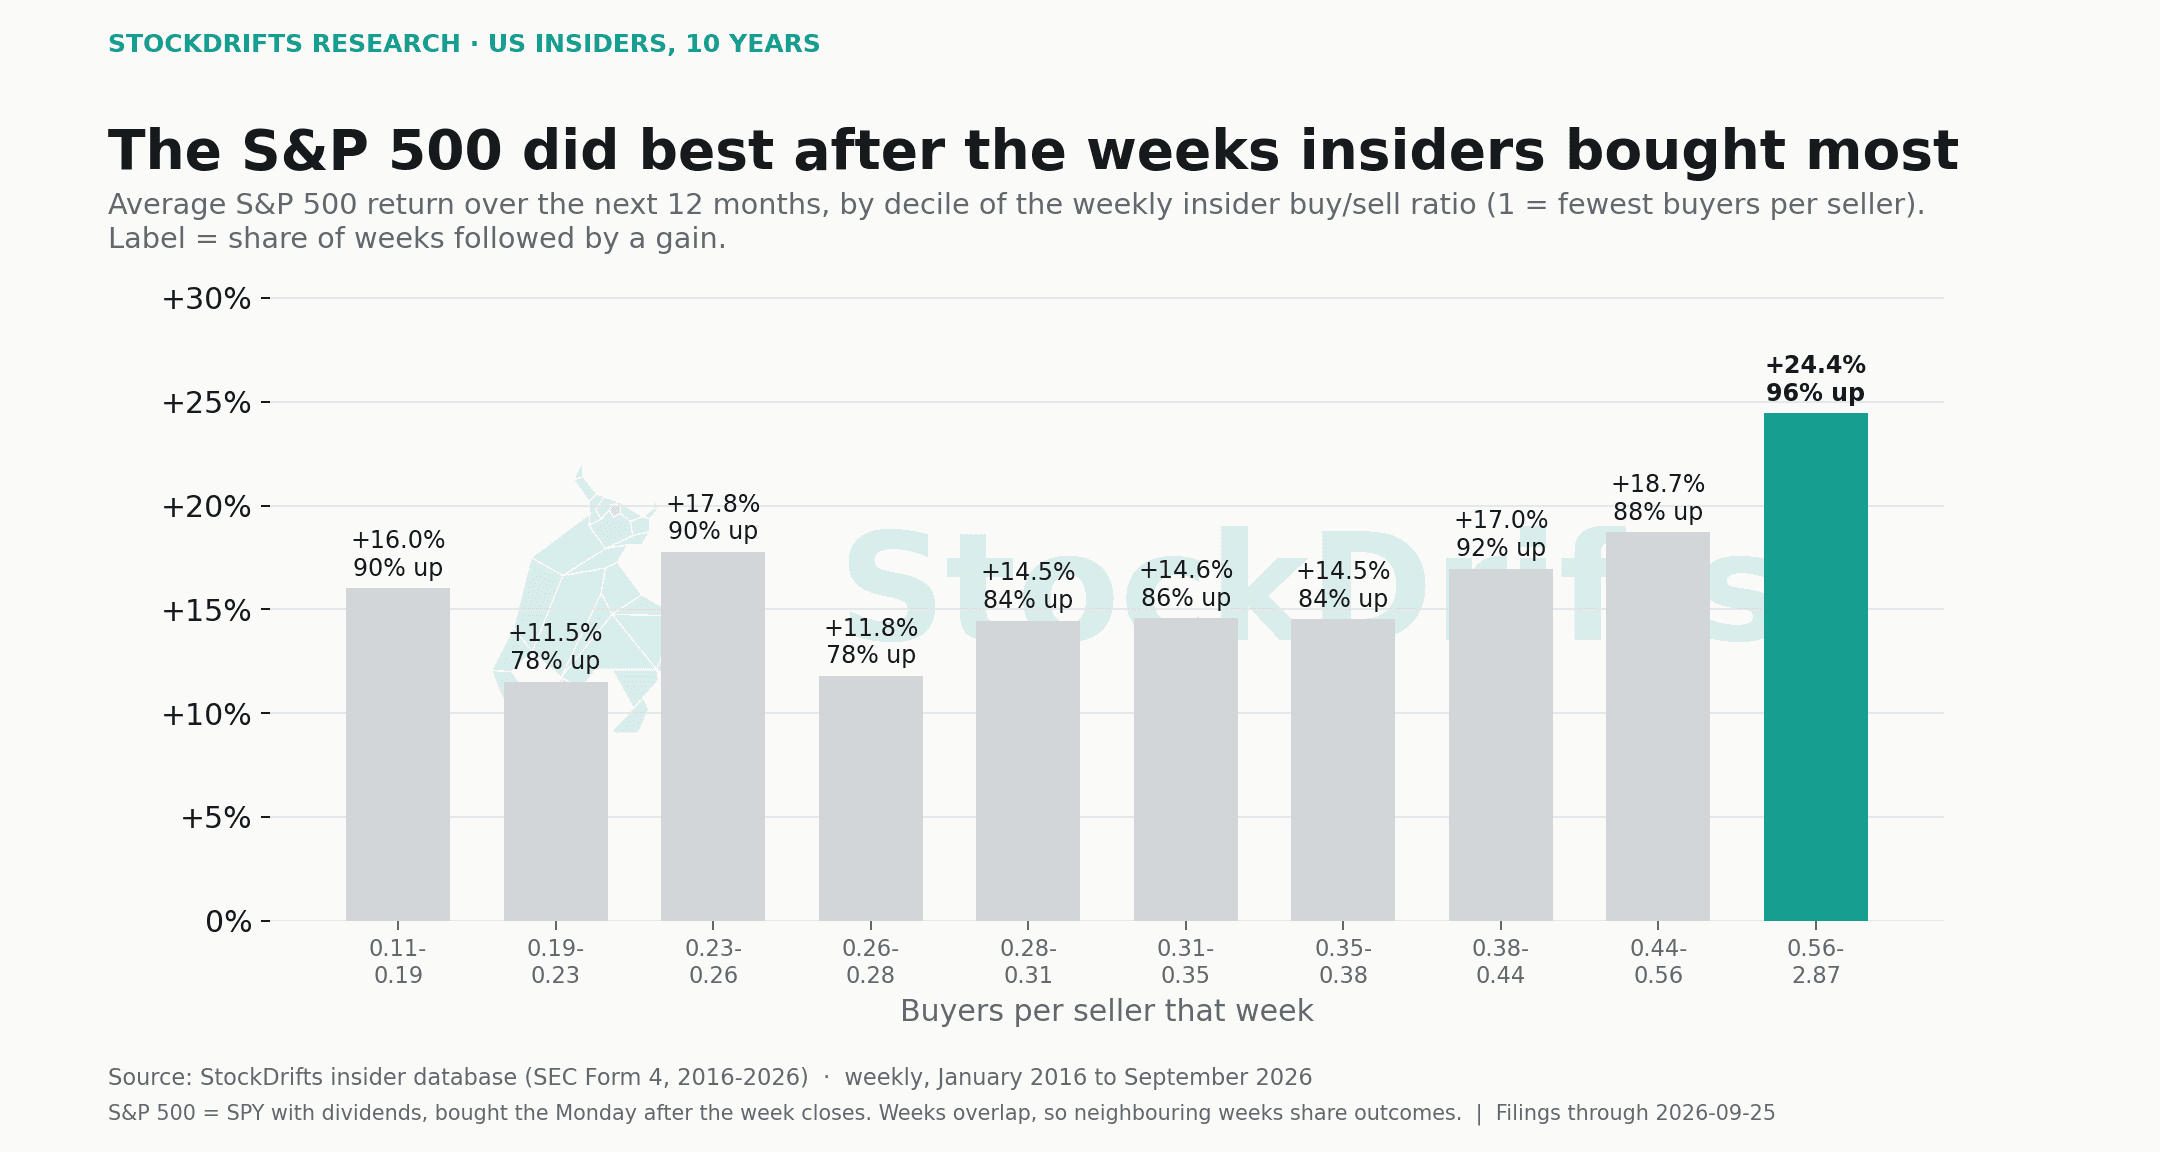
Sort all 507 weeks with a full year of follow-up into ten equal groups by their ratio. The top group, weeks with 0.56 or more buyers per seller, was followed by an average S&P 500 return of +24.4% over twelve months, with 96% of those weeks followed by a gain. The other nine groups ranged from +11.5% to +18.7%. The Russell 2000 showed the same pattern more strongly: +26.2% after the top group.
Below the top group the relationship is weak, and the bottom group, the heaviest selling, was not followed by the worst returns. This is a signal that switches on in unusual weeks, not a dial to read every week.
03 / Every spree
Twelve buying sprees since 2017
Spree weeks come in bursts. Grouping weeks less than five weeks apart gives twelve episodes. The late-2018 selloff, March 2020, the September 2022 low and the spring 2023 regional-bank scare were all followed by strong years. Two episodes were early: in December 2021 and January 2022 insiders bought a market that went on to fall for most of the year, and the spring 2022 buying took a year to break even.
| Episode | Spree weeks | Peak ratio | Peak-week buyers | S&P 500, 6 months | S&P 500, 12 months |
|---|---|---|---|---|---|
| August 18 to August 25 2017 | 2 | 0.65 | 343 | +13.6% | +20.1% |
| October 26 to December 28 2018 | 8 | 1.62 | 233 | +12.5% | +17.2% |
| May 24 to May 31 2019 | 2 | 0.76 | 308 | +12.9% | +8.9% |
| August 16 to August 30 2019 | 2 | 0.74 | 520 | +16.6% | +18.2% |
| March 6 to April 3 2020 | 5 | 2.87 | 1,230 | +26.2% | +43.8% |
| May 15 2020 | 1 | 0.75 | 590 | +23.9% | +41.9% |
| December 3 2021 | 1 | 0.58 | 434 | −9.6% | −12.9% |
| January 28 2022 | 1 | 0.56 | 127 | −8.0% | −8.2% |
| April 29 to July 1 2022 | 7 | 0.91 | 421 | −6.0% | +0.8% |
| September 2 to September 30 2022 | 2 | 0.80 | 156 | +4.4% | +16.8% |
| March 17 to May 26 2023 | 7 | 0.79 | 472 | +13.5% | +32.9% |
| October 27 2023 | 1 | 0.64 | 100 | +23.6% | +41.9% |
04 / The blind spot
Insiders cannot buy in the weeks after a quarter ends
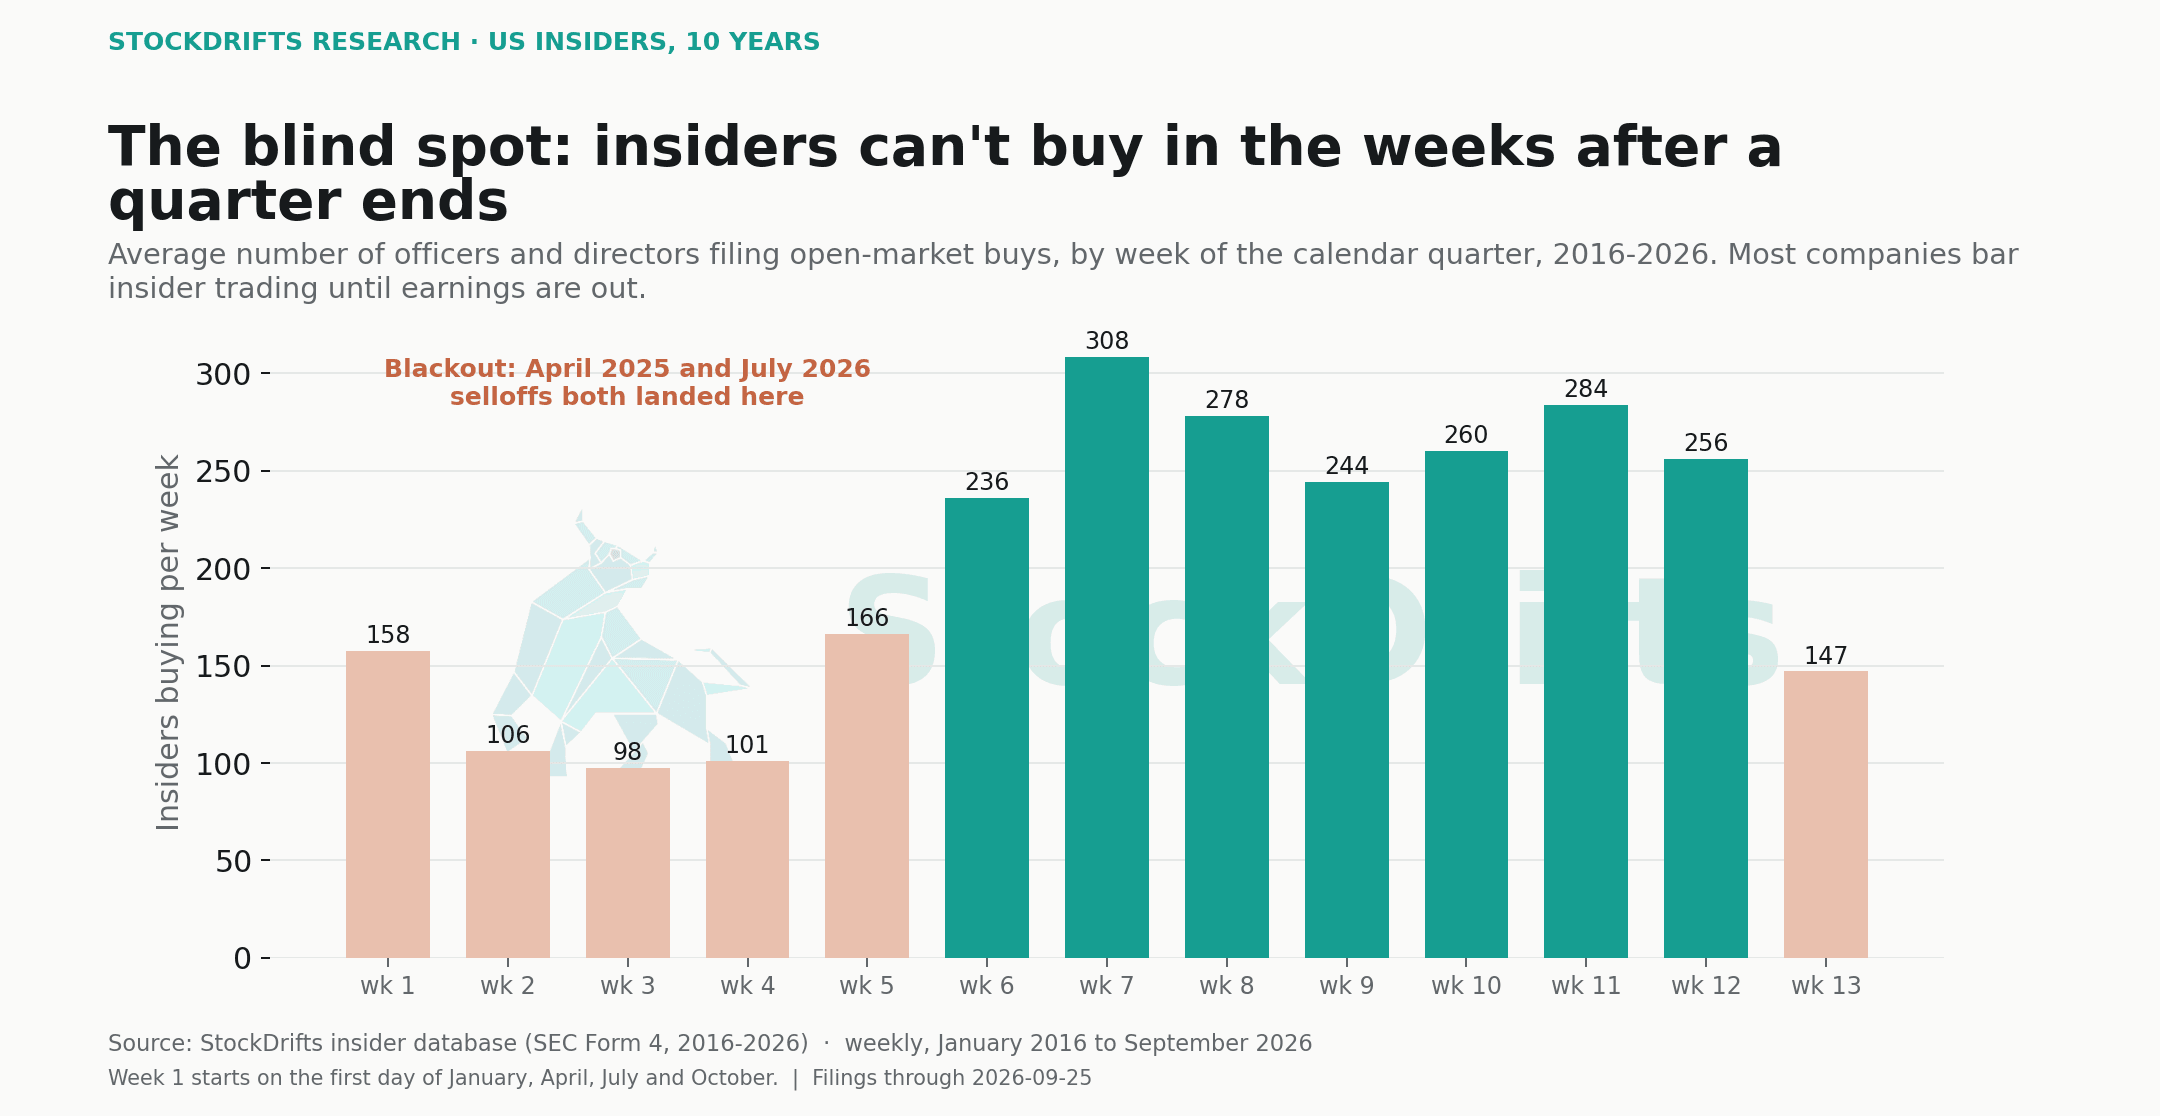
Most companies bar insiders from trading from shortly before the quarter ends until earnings are published. Averaged over the decade, 158 insiders a week filed purchases in the first week of a quarter and around 98 in weeks three and four, against 308 in week seven, once the window opens. A selloff that lands in those early weeks will not show up in the ratio until it is over.
That is what happened in April 2025. The S&P 500 fell 19% between February 19 and April 8, and the ratio peaked at 0.48 in the week to May 2, 2025, in the 84th percentile, short of a spree. July 2026 was the same: during the semiconductor selloff described in our 13F crash study, only 67 insiders filed purchases in the week to July 17, 2026. A quiet ratio in the first five weeks of a quarter means little.
05 / Market, not stocks
Buy the index, not the stocks insiders were buying
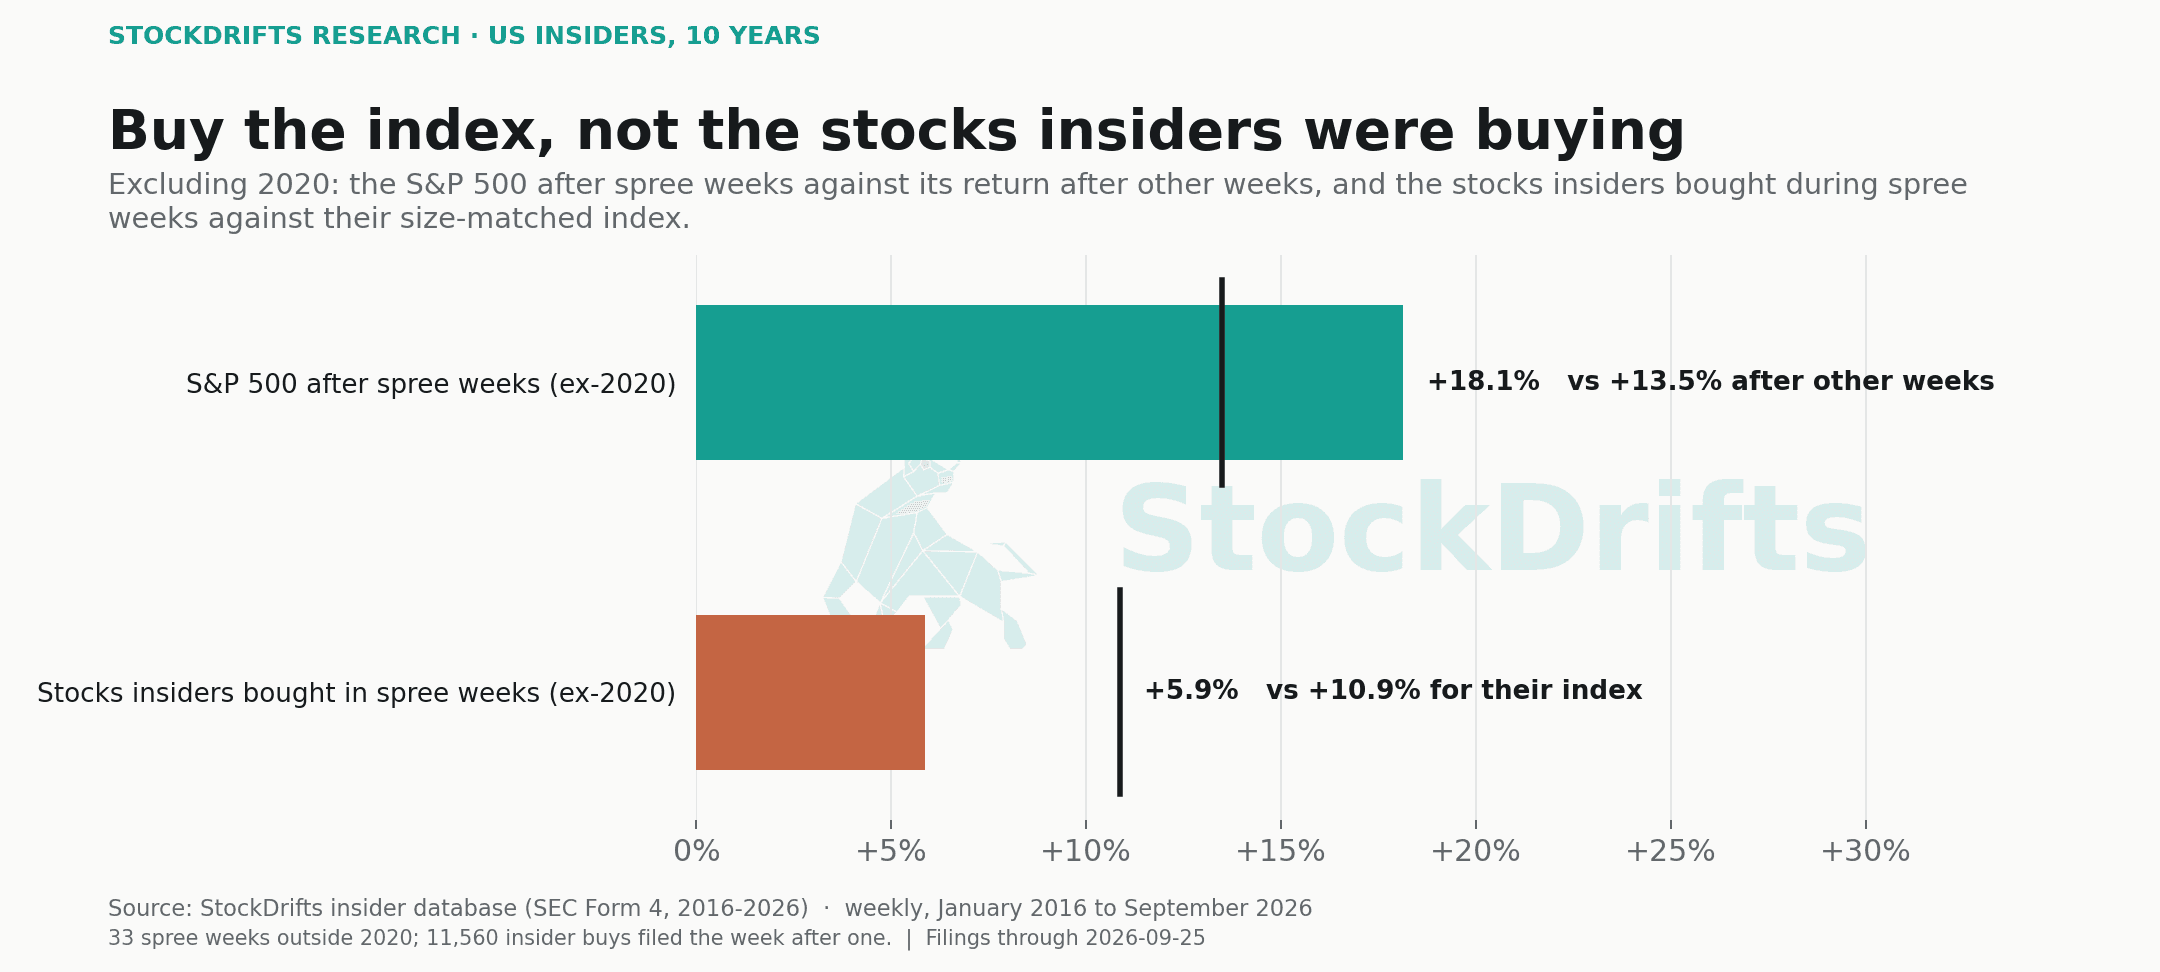
If the whole market's insiders were right, were the particular stocks they bought even better? Only in 2020. Stocks bought by insiders in the week after a spree week returned +41.6% over the next year against +34.2% for their size-matched index across all years, but outside 2020 they returned +5.9% against +10.9%. In the 2022 and 2023 sprees three quarters or more of the purchases were in companies under $2bn, and in 2023 almost half were in financial stocks, mostly banks; the index recovered on large-cap technology instead.
06 / Where it stands
This week's reading
In the week to September 25, 2026, 148 insiders filed purchases and 366 filed sales: a ratio of 0.40, in the 76th percentile of all weeks since 2016 and higher than 95% of weeks since January 2024. It is not a spree. The ratio has run lower since 2024 (average 0.26, against 0.39 in 2016-2023) as rising prices and stock-based pay have added sellers, so a spree measured against the whole decade is harder to reach than it was. The highest reading since January 2024 was 0.48 in the week to May 2, 2025, a month after the 2025 low.
| Week to | Insiders buying | Insiders selling | Ratio | Percentile vs all earlier weeks |
|---|---|---|---|---|
| August 7, 2026 | 165 | 888 | 0.19 | 10th |
| August 14, 2026 | 281 | 895 | 0.31 | 52th |
| August 21, 2026 | 269 | 1009 | 0.27 | 37th |
| August 28, 2026 | 193 | 716 | 0.27 | 38th |
| September 4, 2026 | 180 | 869 | 0.21 | 15th |
| September 11, 2026 | 162 | 564 | 0.29 | 43th |
| September 18, 2026 | 227 | 749 | 0.30 | 48th |
| September 25, 2026 | 148 | 366 | 0.40 | 76th |
07 / How it is built
Definitions
Counts. Distinct officers and directors (by SEC reporting-owner ID) who filed at least one open-market purchase (Form 4 code P) or sale (code S) in the week, by filing date, weeks ending Friday. 10% owners who are not officers or directors are left out, as are grants, option exercises, tax withholding and gifts. Spree. A week whose ratio exceeds 90% of all previous weeks' ratios (the first 26 weeks of 2016 are the warm-up). Returns. SPY and IWM with dividends, from the close on the Monday after the week to the last close on or before 91, 182 and 365 days later. Weekly windows overlap, so the 39 spree weeks are about a dozen independent episodes; treat the averages as a description of those episodes. Full data definitions are in the methodology of the series.
08 / Questions
Questions this study answers
- What is the insider buy/sell ratio?
- It is the number of company insiders (officers and directors) who filed open-market purchases in a week, divided by the number who filed open-market sales. It counts people, not dollars, so one large seller cannot swamp it. Most weeks it sits between 0.2 and 0.4 (median 0.31): insiders sell far more often than they buy, because much of their pay arrives in stock.
- Is insider buying a sign of a market bottom?
- Often, though not reliably at the exact bottom. In the 39 weeks since 2017 when the ratio ranked in the top 10% of all earlier weeks, the S&P 500 returned +24.1% on average over the next 12 months and was higher a year later 95% of the time, against +15.4% and 86% after other weeks. The signal fired early in 2022 and missed the April 2025 bottom, which fell in an earnings blackout.
- What is the insider buy/sell ratio now?
- In the week to September 25, 2026, 148 insiders filed purchases and 366 filed sales, a ratio of 0.40. That is higher than 95% of weeks since January 2024 and in the 76th percentile of all weeks since 2016, below the top-10% level that marked past buying sprees.
- Does insider selling predict a market decline?
- Not on its own. The weeks with the fewest buyers per seller were followed by an average S&P 500 return of +16.0% over 12 months, higher than the middle deciles. Heavy selling is the normal state: insiders are paid in stock and sell it on schedules. The information is on the buying side. For individual stocks, insider selling in thinly traded companies is a different matter.
This study describes past trades and what their stocks did afterwards. It is not a recommendation to buy or sell any security. Averages over thousands of trades say nothing certain about the next one, and the trades named here are examples, not picks.
More in this series
- Ten years of insider buying: what 113,117 Form 4 purchases returned, and where the returns came fromOriginal Research · September 29, 2026
- When CEOs bet big on their own stock: liquid names paid, thin ones did notOriginal Research · September 29, 2026
- Cluster buying: what happened when several insiders bought the same stockOriginal Research · September 29, 2026
- The microcap trap: falling knives, insider selling and the rules that did not payOriginal Research · September 29, 2026