 StockDrifts
The average insider buy returned +17.5% in a year. One crash did most of the work
We followed 113,117 open-market purchases by US corporate insiders, from the day each Form 4 became public to twelve months later, and set every one against an index of same-size companies over the same dates. Copying all of them beat that index, narrowly. The typical purchase did much worse than the average, and buys made in 2020 supplied most of the decade's advantage.
Average insider buy, next 12 months
+17.5%
Size-matched index +15.5% · S&P 500 +17.2%
Typical (median) buy
+5.6%
56% of buys were up after a year
Buys filed in 2020
+83.2%
Index +61.1% · 14,631 buys
Every other year combined
+7.7%
Index +8.7% · 98,486 buys
The reading in 30 seconds
- The average of 113,117 insider purchases returned +17.5% over the following year, against +15.5% for same-size companies and +17.2% for the S&P 500. The typical purchase returned +5.6%: a few very large winners pull the average up, and the top 1% of purchases produced 34% of all the gains.
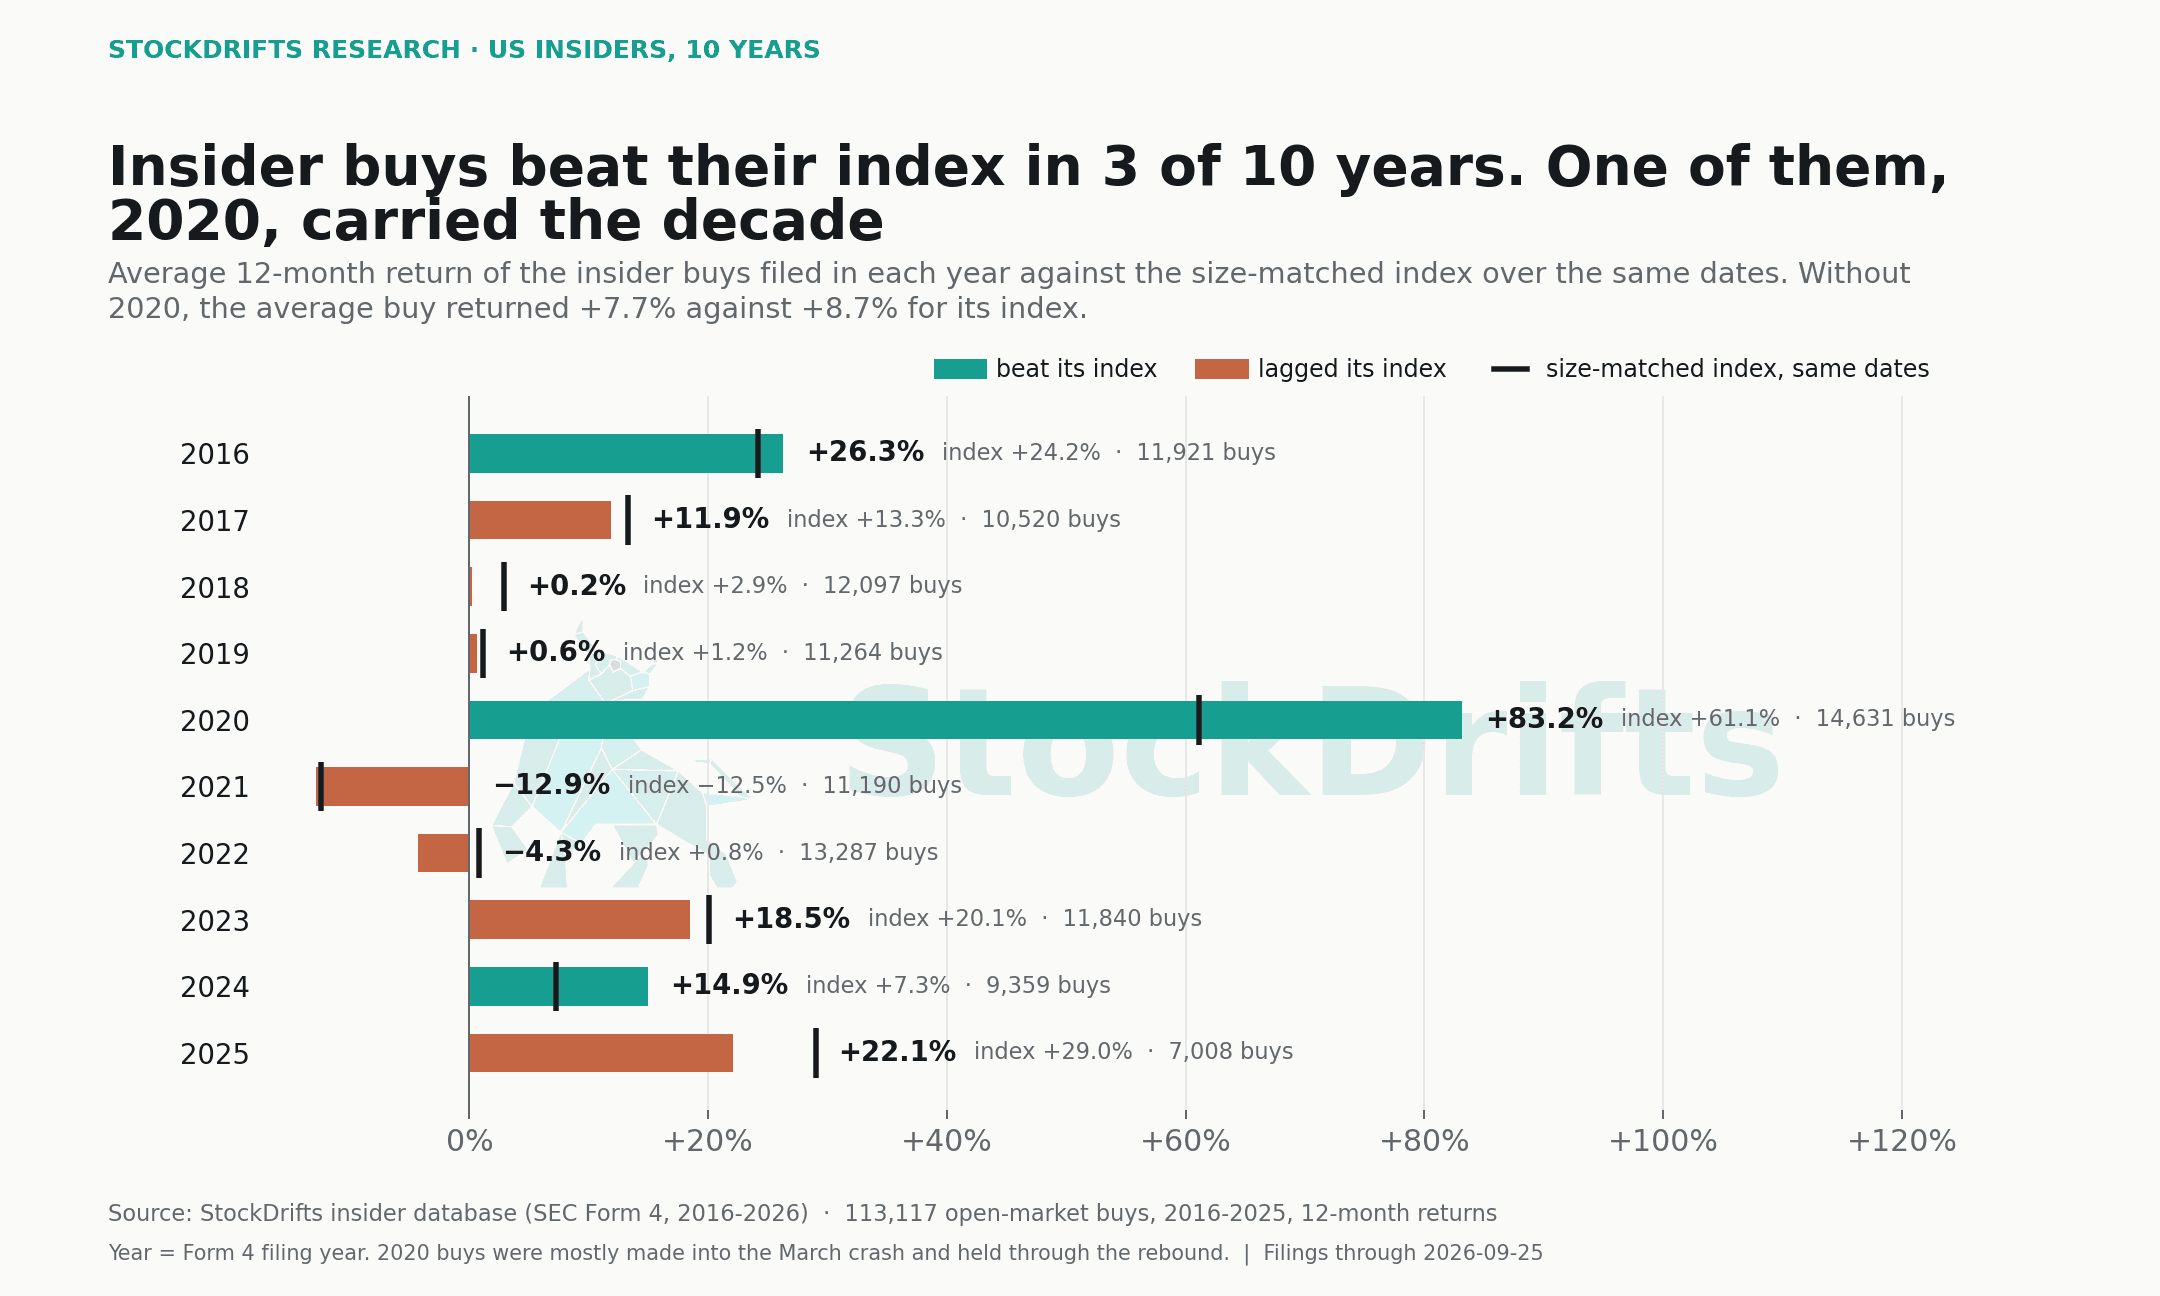
- Insider buys beat their index in 3 of ten years (2016, 2020, 2024). Buys filed in 2020 returned +83.2% against +61.1%; those filed in March and April 2020 alone returned +126.0%. Every other year combined: +7.7% against +8.7%.
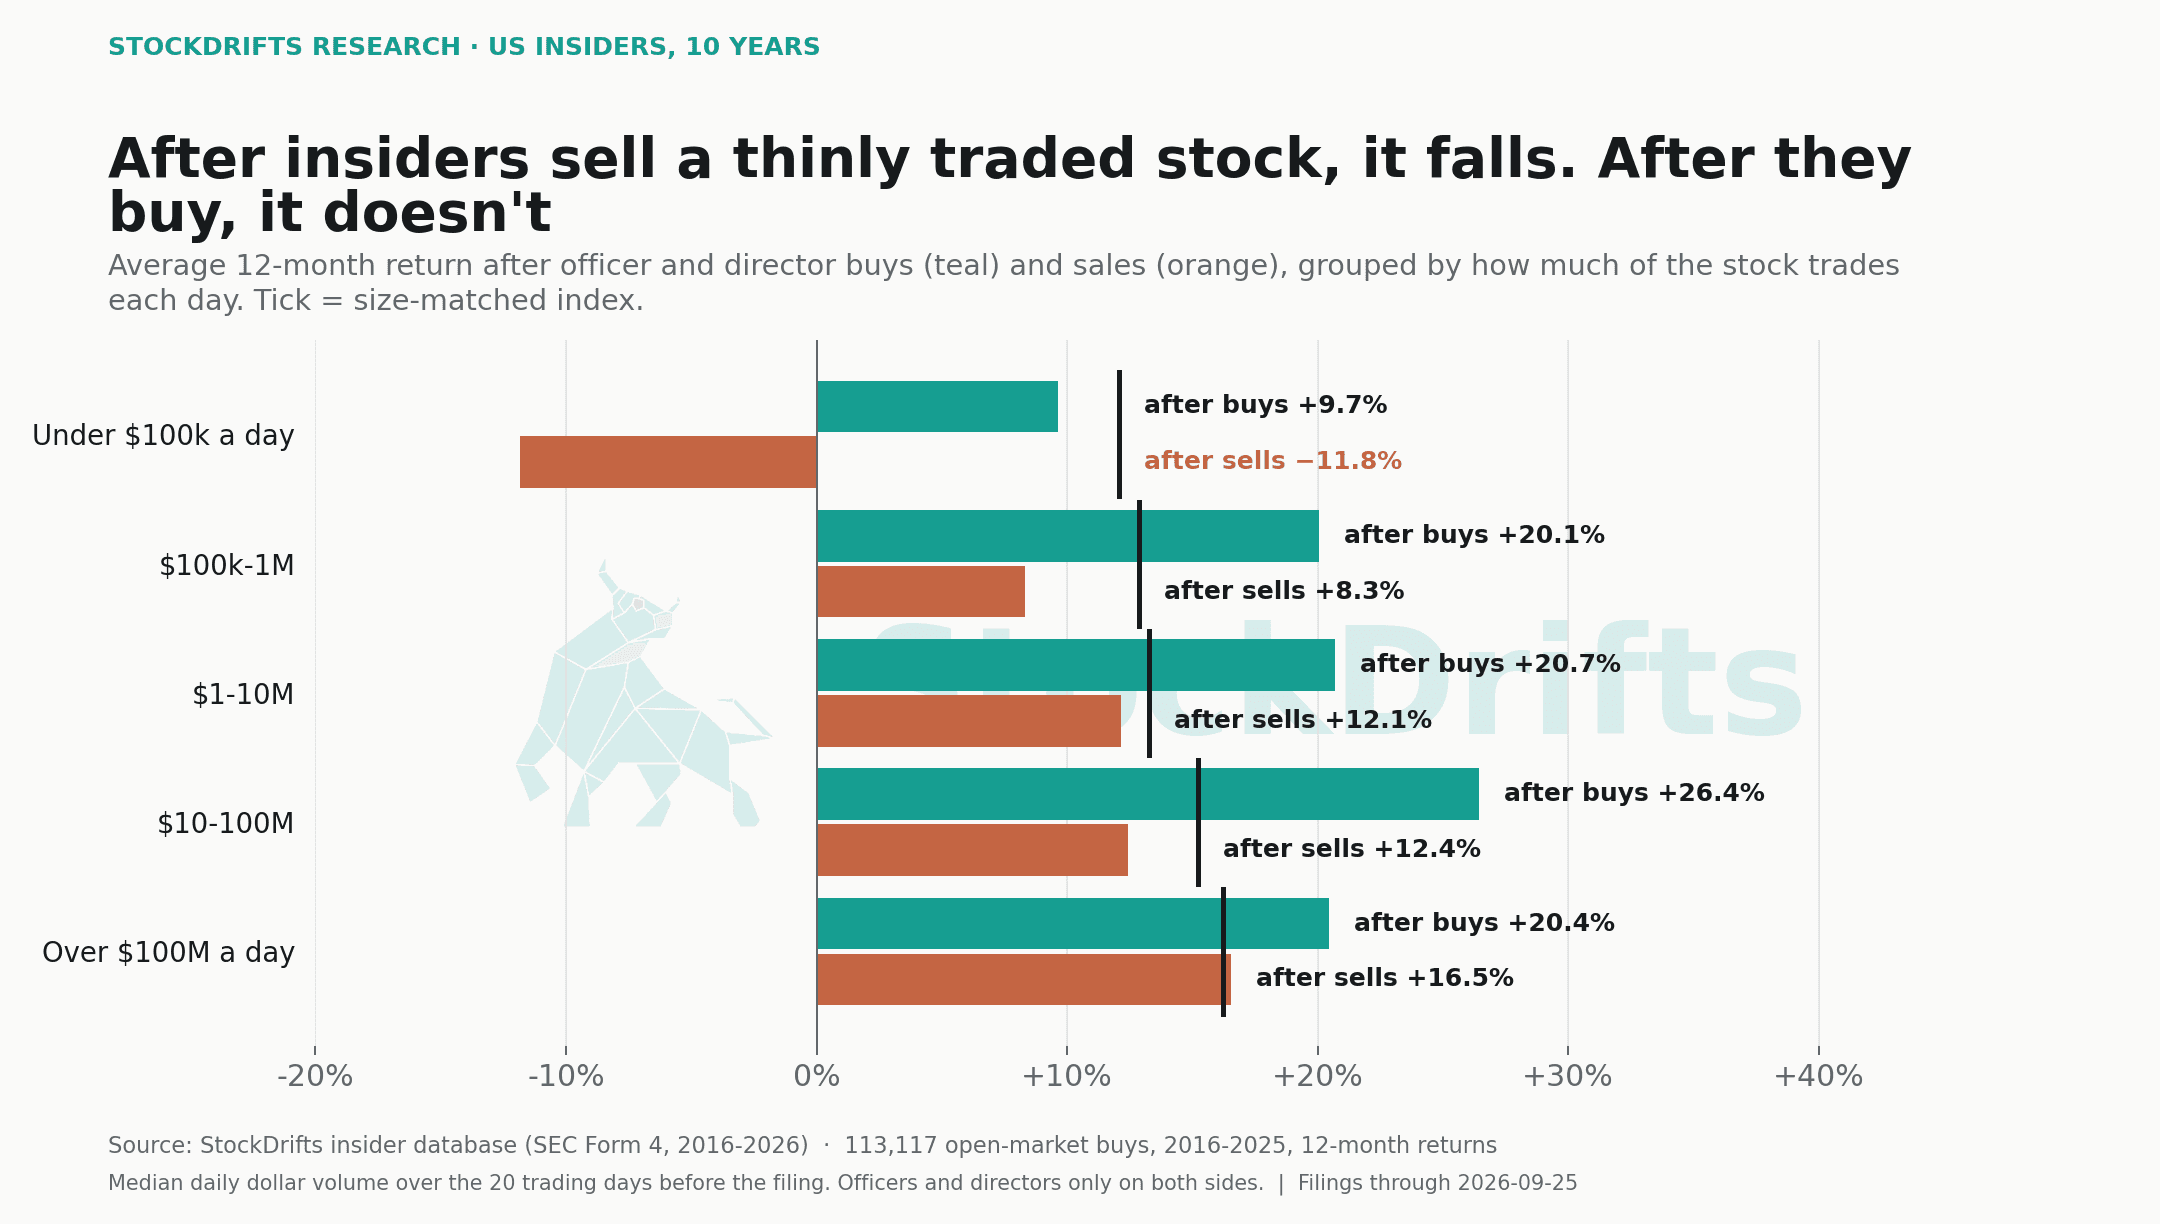
- The signal is real where insiders sell. After officers and directors sold stocks trading under $100k a day, those stocks returned −11.8% over the next year; after they bought them, +9.7%. Directors did better than CEOs, and funds filing as 10% owners did worst.
01 / The headline
The average buy and the typical buy are different animals
Take every open-market purchase an officer, director or 10% owner reported on Form 4 between January 2016 and September 2025. Buy each stock at the close on the day after the filing, the first price an outsider could act on, and hold it for twelve months. The average purchase returned +17.5%. An index of companies the same size, bought and sold on the same dates, returned +15.5%; the S&P 500 returned +17.2%.
That average hides a lopsided distribution. The typical (median) purchase returned +5.6%. 10% of purchases lost half their value within the year and 7% doubled. The top 1%, 1,131 purchases, produced 34% of all the gains: GeneDx in late 2023, Sezzle the same month, GameStop and Overstock in the spring of 2020. Someone who copied every insider buy would have earned roughly the average. Someone who copied a handful would most likely have earned something near the median.
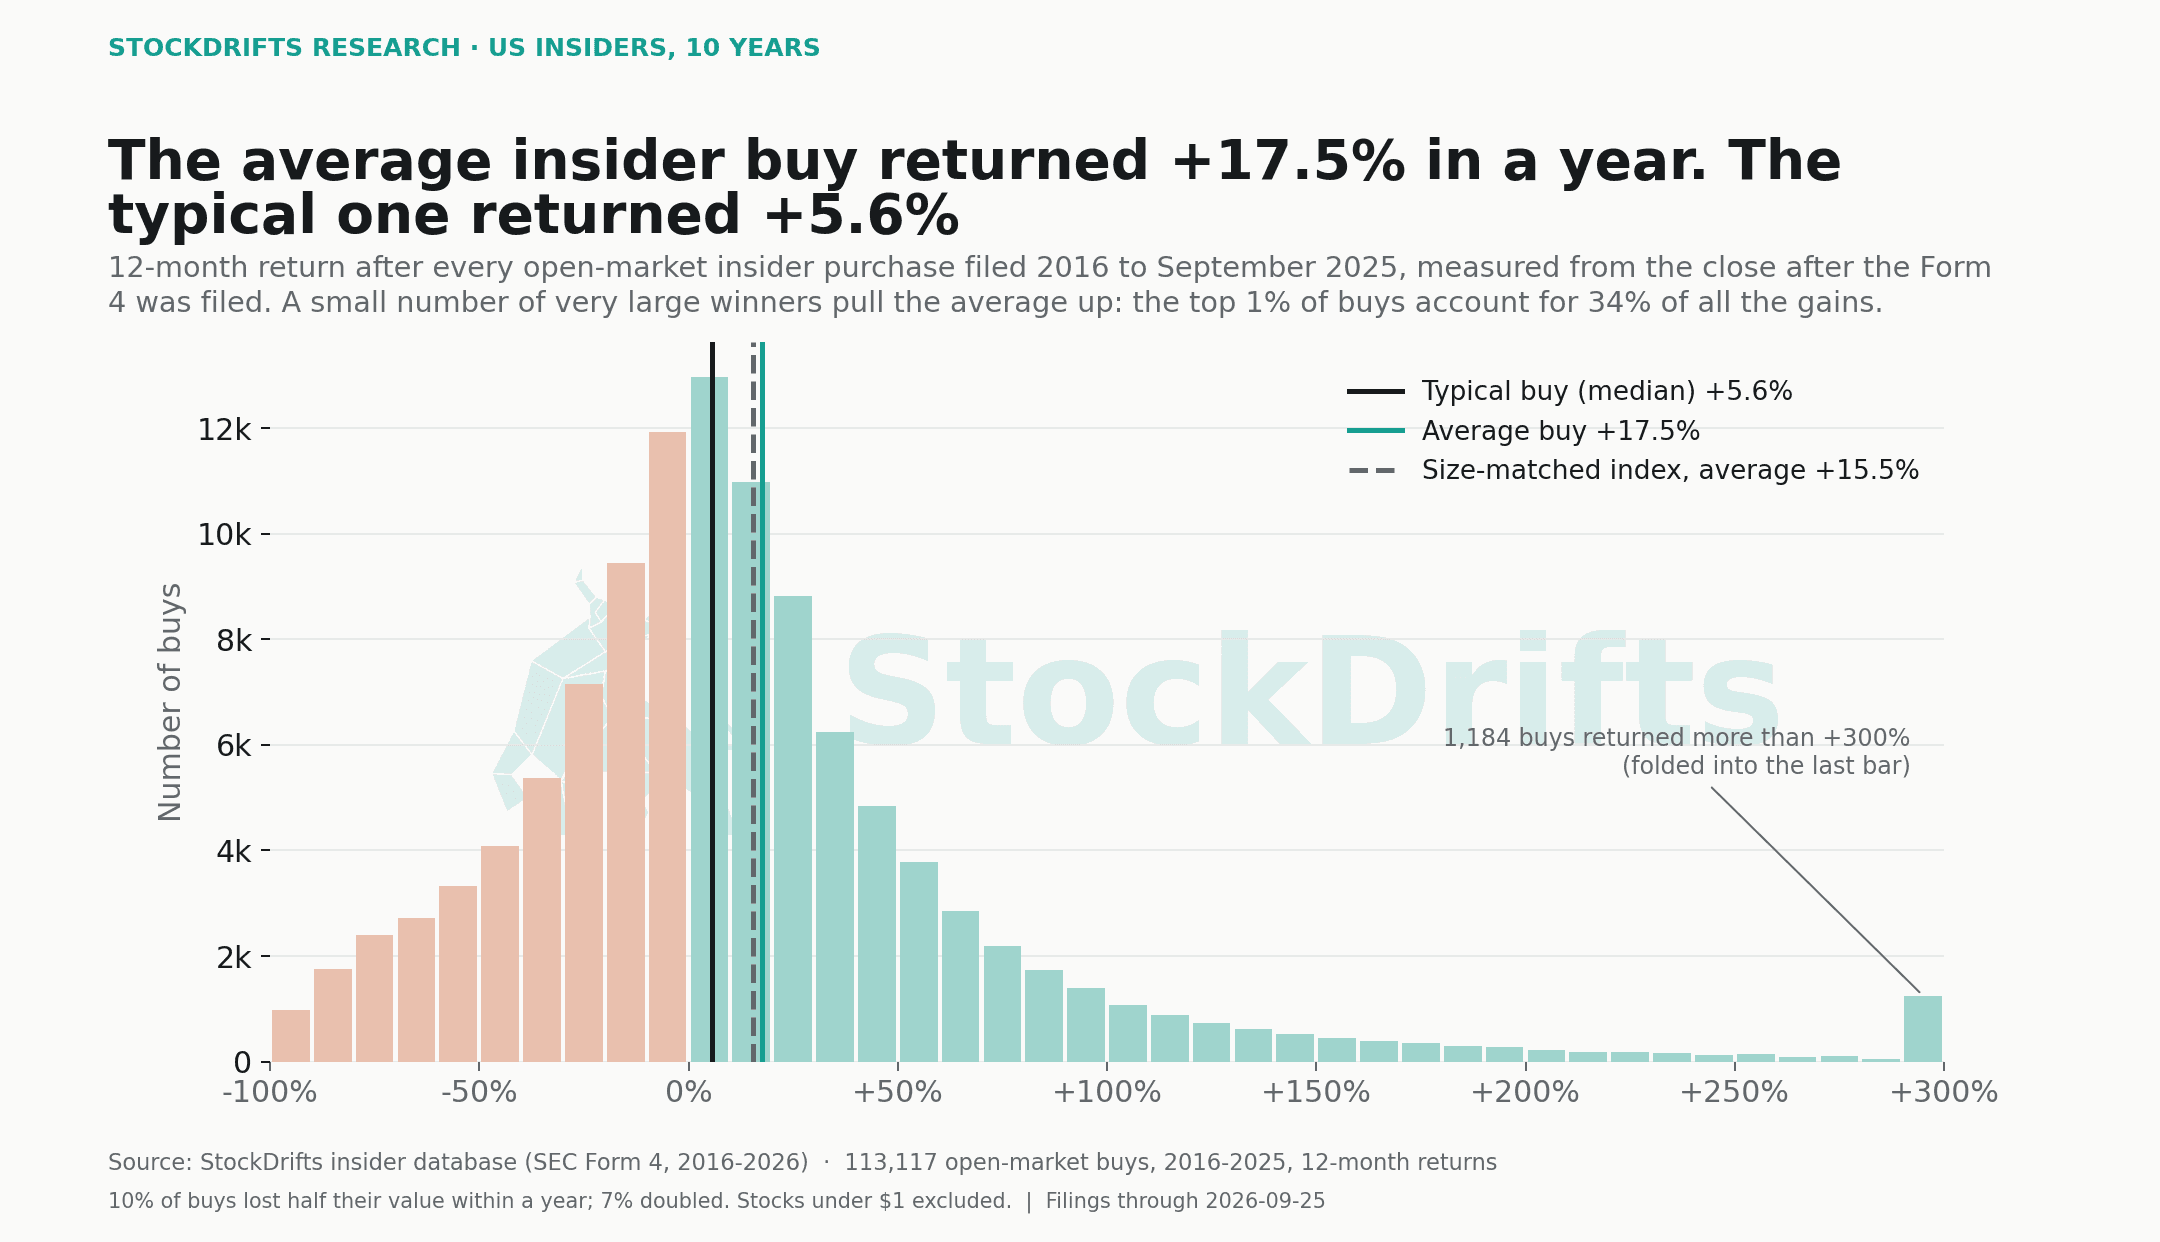
Shorter holding periods tell the same story with less in it. Over one month the average purchase returned +1.4% against +1.3% for the index; over three months +4.9% against +4.6%; over six months +7.7% against +7.7%. Whatever edge there is takes the full year to show.
02 / Year by year
Three good years, and one of them carried the decade
Group the purchases by the year they were filed and the picture changes. Insider buys beat their index in 2016, 2020, 2024, and trailed it in every other year. Purchases filed in 2020 returned +83.2% against +61.1% for their index. The largest share was made in March and April, into the Covid crash: 5,056 purchases filed in those two months returned +126.0% over the next year. Measured against the size-matched index, 2020 accounts for more than all of the decade's advantage; in the other nine years combined, the average purchase returned +7.7% against +8.7%.
That is not a reason to ignore insiders. It says when to pay most attention: insiders were the buyers of last resort in the one real crash of the period, and a separate study in this series, the insider buy/sell ratio, shows how to see that moment in the weekly filings.
| Year | Purchases | Average return | Size-matched index | S&P 500 | Typical (median) |
|---|---|---|---|---|---|
| 2016 | 11,921 | +26.3% | +24.2% | +19.8% | +22.3% |
| 2017 | 10,520 | +11.9% | +13.3% | +14.0% | +4.5% |
| 2018 | 12,097 | +0.2% | +2.9% | +10.6% | −2.6% |
| 2019 | 11,264 | +0.6% | +1.2% | +12.8% | −12.9% |
| 2020 | 14,631 | +83.2% | +61.1% | +40.9% | +53.9% |
| 2021 | 11,190 | −12.9% | −12.5% | −3.8% | −9.7% |
| 2022 | 13,287 | −4.3% | +0.8% | +6.8% | −8.6% |
| 2023 | 11,840 | +18.5% | +20.1% | +29.1% | +10.0% |
| 2024 | 9,359 | +14.9% | +7.3% | +15.6% | +7.6% |
| 2025 | 7,008 | +22.1% | +29.0% | +22.4% | +11.7% |
03 / The follower's handicap
By the time you read the Form 4, the stock has already moved
Insiders have two business days to file. The median purchase in our data was filed 2 days after the trade, and a reader of the filing can buy at the next close at the earliest. Between the insider's own price and that first close, the stock moved +2.3% on average (median +0.8%); in 22% of cases it had already risen more than 5%, and in 38% it had fallen. Over the next twelve months the insider's own purchase returned +19.7% on average and the follower's +17.3%.
A recent example: Grab Holdings' chief executive Anthony Tan bought 10.35 million shares at $2.89 on September 21, 2026, and filed the same day. The stock closed at $3.17 the next day, 9.8% above his price. Late filers did no better: purchases filed more than four days after the trade returned +13.0% (5 to 30 days late) and +11.5% (more than 30 days late), both below their index.
| Filing delay | Purchases | Average return | Size-matched index | Typical (median) |
|---|---|---|---|---|
| 0-2 days | 74,411 | +17.6% | +15.8% | +5.9% |
| 3-4 days | 28,461 | +18.9% | +15.3% | +4.9% |
| 5-30 days | 7,920 | +13.0% | +14.4% | +5.6% |
| over 30 days | 2,325 | +11.5% | +12.9% | +4.2% |
04 / Who bought
Directors and CFOs did best, funds did worst
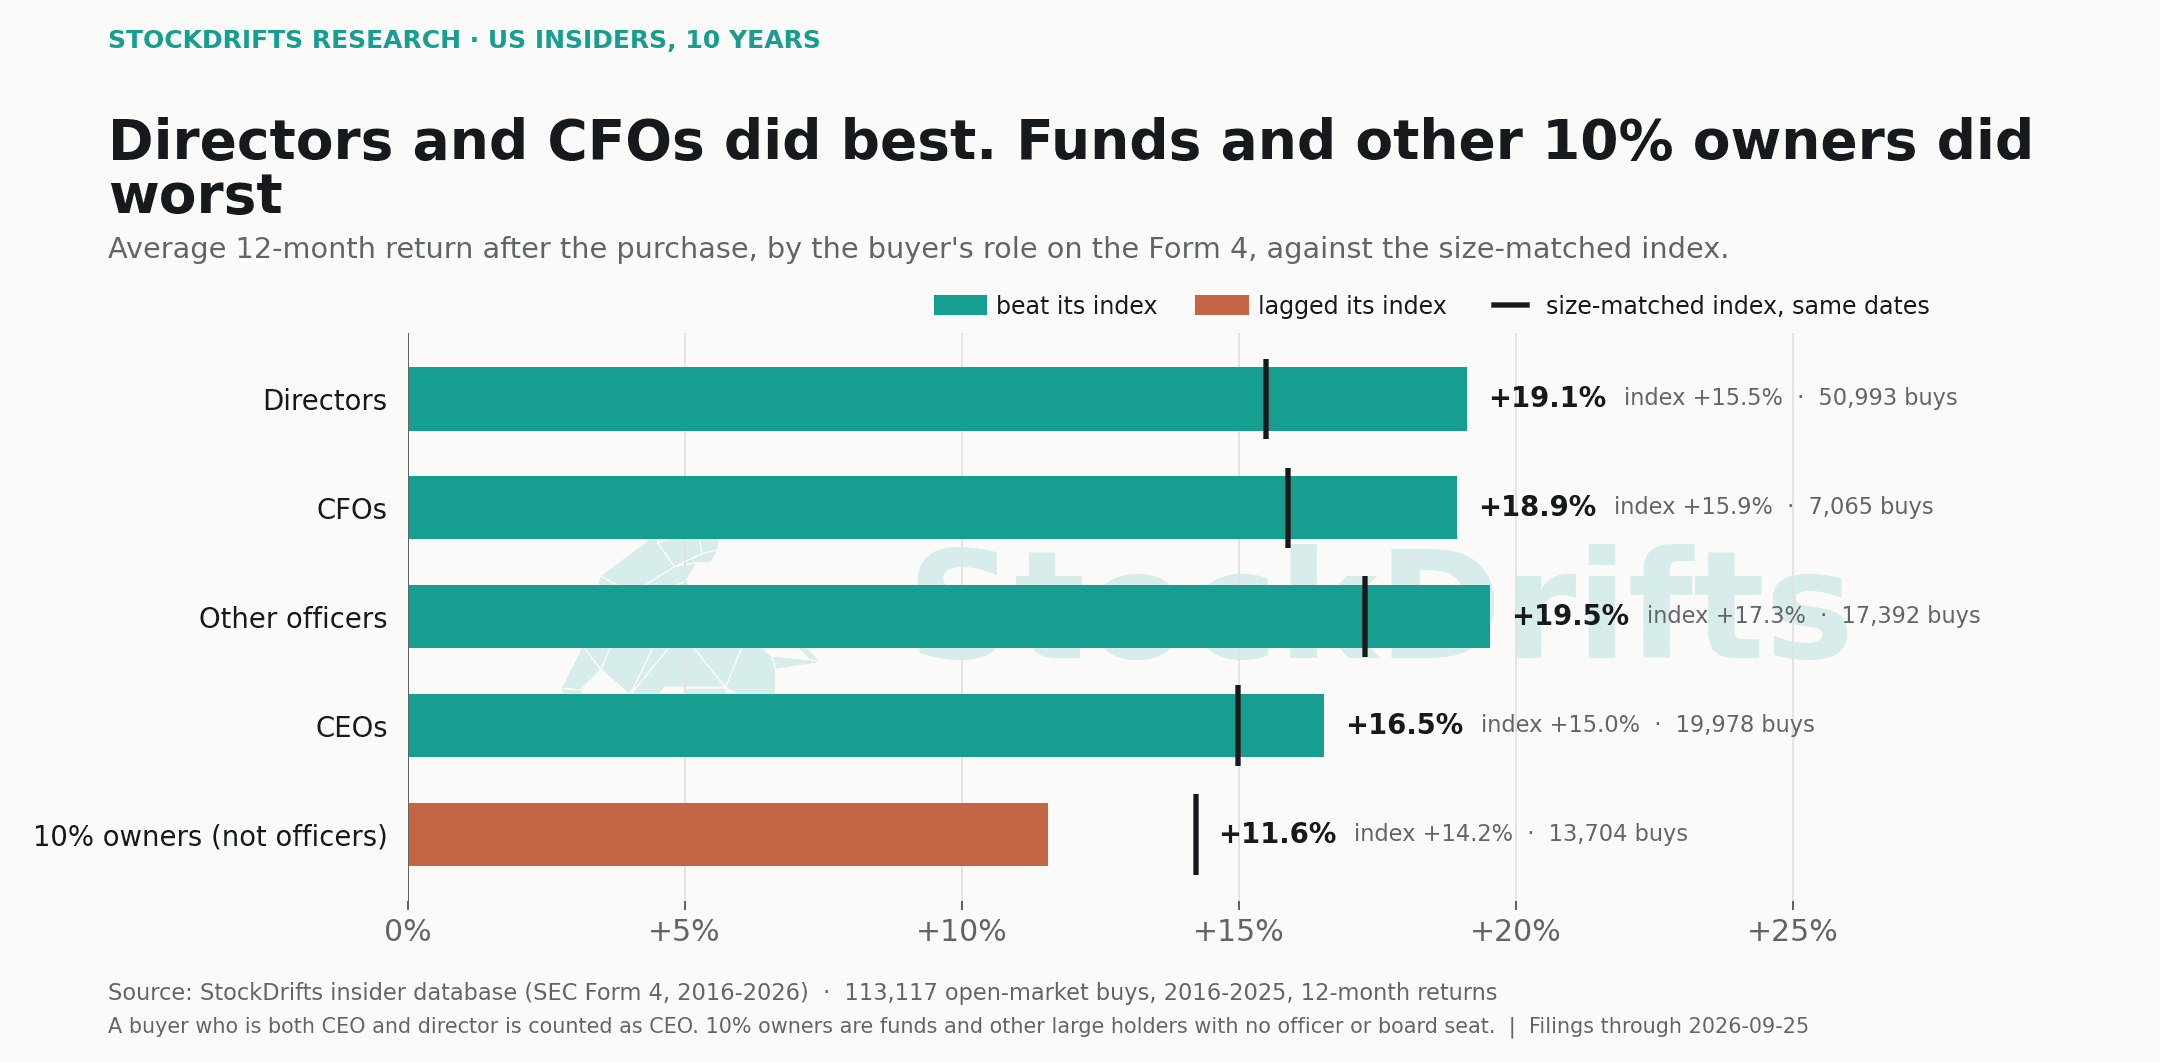
The role on the filing matters more than the size of the cheque. Purchases by directors returned +19.1% on average against +15.5% for their index, and by chief financial officers +18.9% against +15.9%. Chief executives came in lower, +16.5% against +15.0%, with a typical purchase of only +1.9%. Funds and other holders filing only as 10% owners returned +11.6% against +14.2%: many of their purchases are private placements and financing rounds rather than open-market bets.
Without 2020 the order holds and the gaps widen. Directors still beat their index (+9.9% against +8.5%); CEOs (+4.8% against +8.4%) and 10% owners (+5.1% against +9.8%) did not. Size worked against the buyer too: purchases over $5M returned +10.0% against +13.0%, purchases under $250k did better than their index. The CEO study shows that what matters for a CEO is the share of their own stake, not the dollar amount.
| Purchase size | Purchases | Average return | Size-matched index | Typical (median) |
|---|---|---|---|---|
| under $50k | 62,338 | +18.0% | +15.6% | +6.3% |
| $50-250k | 28,927 | +19.3% | +16.2% | +5.9% |
| $250k-1M | 12,095 | +14.6% | +14.8% | +3.9% |
| $1-5M | 6,145 | +13.6% | +14.3% | +2.5% |
| over $5M | 3,612 | +10.0% | +13.0% | +0.2% |
05 / Buys against sells
Where the information shows up: thinly traded stocks that insiders sell
If insider purchases carry information, the stocks insiders buy should do better than the stocks they sell. They did, in every liquidity band. The gap is widest in the thinnest stocks. After officers and directors sold a stock trading under $100k a day, it returned −11.8% over the next year while its index returned +10.8%; after they bought one, +9.7%. In stocks trading $10M to $100M a day, bought stocks returned +26.4% against +19.1% for their index, and sold stocks +12.4% against +11.3%.
Most insider selling in large companies is compensation turning into cash, and the stocks behave like their index afterwards. In small companies a sale is rarer and says more. The microcap study follows that thread: in 2021 to 2025, the thinnest stocks fell by nearly a third in the year after insiders sold.
06 / What to do with it
Five rules the data supports
1. Treat a single insider purchase as a lead, not a trade. The typical purchase returned +5.6% in a year. Research the company as you would any other idea.
2. Stay in stocks that trade. Purchases in stocks trading under $100k a day returned +9.2% against +13.4% for their index; purchases in stocks trading $10M to $100M a day returned +25.7% against +18.4%. The microcap trap has the detail.
3. Weight conviction, measured properly. Several insiders buying the same liquid stock, or a CEO adding a quarter or more to their stake in one, did better than a lone purchase. See cluster buying and CEO big bets.
4. Watch the whole market's insiders, not one company's. When insiders across the market buy in unusual numbers, the index has done well the following year. The buy/sell ratio study tracks it weekly.
5. Take insider selling in small companies seriously. It was the clearest warning in ten years of filings.
07 / Explore the evidence
Download the tables
08 / Database coverage
3,181,459 Form 4 lines, 113,117 purchases with a full year
- Form 4 transaction lines
- 3,181,459
- Every line filed January 2016 to September 25, 2026
- Open-market purchase lines
- 318,878
- Transaction code P
- Purchase decisions
- 132,469
- One per insider, company and filing date
- With a full 12-month return
- 113,117
- Filed through September 2025 · 6,477 companies
09 / Methodology & limitations
Exactly what went into this study
The filings. Every Form 4 and Form 4/A transaction line filed with the SEC from January 4, 2016 to September 25, 2026: the SEC's quarterly insider transaction data sets through June 2026, and daily EDGAR filings after that. 318,878 lines carry code P (purchase) and 917,795 code S (sale). Grants, option exercises, tax withholding, gifts and conversions are left out because they are not trading decisions.
Cleaning. We keep lines whose reported price matches the stock's market price that day (282,942 purchase lines), drop amendments that repeat an original filing, and count a purchase reported by several joint filers (a fund, its general partner and a board member, say) once, leaving 232,627. Lots filed together by one insider in one filing become one purchase decision: 132,507. Strategic blocks of $500M or more are removed, such as Berkshire Hathaway's Bank of America stake and take-private tenders (132,469 remain).
The return. From the adjusted close on the trading day after the filing to the last close on or before twelve months later, dividends and splits included. A stock that stops trading inside the window keeps its last price, so bankruptcies count as losses and takeovers at their deal price. We recompute every return from daily prices and drop windows with a pricing gap of more than 30 days or a one-day move above +500% or below −90% (1,078 purchases), and stocks priced under $1 at entry (8,045).
The benchmark. Each purchase is compared with an index of companies its size over the identical dates: the Russell 2000 (IWM) below $2bn of market value, the S&P 400 mid-cap (MDY) from $2bn to $10bn, the S&P 500 (SPY) above. Market value on the filing date is today's value scaled by the price change since; for companies that no longer trade it is estimated from trading volume. We also show the S&P 500 alone, which is what most readers would otherwise own.
Averages and medians. The average is what an equal-sized basket of every purchase earned. The median is the typical single purchase. Where a handful of extreme winners could move a small group's average, the text says so, and the summary file carries a trimmed version.
Roles and liquidity. Roles come from the filing: CEO and CFO from the officer title, directors from the director box, 10% owners who are neither. Liquidity is the median daily dollar volume over the 20 trading days before the filing.
Limits. Form 4 shows what insiders did, not why. Some P lines are private placements rather than open-market trades. A 12-month window starting in 2020 captures a rebound few windows will repeat. Sources: SEC Form 4 filings; daily prices from EODHD, including delisted stocks. Scripts and intermediate tables are kept with the study.
10 / Questions
Questions this study answers
- Does insider buying work?
- On average, a little, and unevenly. Across 113,117 open-market insider purchases filed from 2016 to September 2025, the average stock returned +17.5% over the next 12 months, against +15.5% for a size-matched index over the same dates and +17.2% for the S&P 500. The typical purchase returned +5.6%. Most of the advantage came from purchases filed in 2020; without them, the average purchase returned +7.7% against +8.7% for its index. The rest of this series shows where insider buying did and did not pay.
- Do insider purchases predict stock returns?
- Weakly on their own, more clearly in context. Stocks that officers and directors bought did better over the next year than stocks they sold, in every liquidity band we measured. After insider sales in stocks trading under $100k a day, the average stock returned −11.8% while its index returned +10.8%. Purchases by several insiders at once and large CEO purchases in liquid stocks did better than single purchases.
- What is SEC Form 4?
- Form 4 is the filing a company's officers, directors and holders of more than 10% of its shares must send the SEC within two business days of buying or selling the company's stock. Each line carries a transaction code: P is an open-market or private purchase, S is a sale, and codes such as A (grants), M (option exercises) and F (tax withholding) are not trading decisions. This study uses only P and S. The median purchase in our data was filed 2 days after the trade.
- What is a 10b5-1 plan, and do plan purchases matter?
- A 10b5-1 plan is a trading plan an insider sets up in advance, so the trades run on a schedule rather than on a fresh decision. Since April 2023 Form 4 has a checkbox for it. From then to September 2025, 992 plan purchases returned +21.8% on average against +19.5% for their index; 24,458 discretionary purchases returned +19.5% against +18.3%. Plan purchases are rare and did not behave differently. Before 2023 the flag comes from footnotes, and one family at Hyster-Yale filed about 30,000 plan purchase lines by itself.
- How fast do I need to act on a Form 4?
- Speed helps less than people think. Between the insider's own trade and the first close a reader could buy at, the stock moved +2.3% on average (median +0.8%), and in 22% of cases more than 5%. From that entry point the next month was close to flat against the index (+1.4% against +1.3%). The insider's own 12-month return averaged +19.7%; the follower's +17.3%.
- Which stocks are insiders buying right now?
- The two live lists in this series are the CEO purchases since August 2026 that raised the CEO's stake by a quarter or more and the stocks where three or more insiders bought within 30 days. Both come with the history of how similar purchases did.
This study describes past trades and what their stocks did afterwards. It is not a recommendation to buy or sell any security. Averages over thousands of trades say nothing certain about the next one, and the trades named here are examples, not picks.
More in this series
- When CEOs bet big on their own stock: liquid names paid, thin ones did notOriginal Research · September 29, 2026
- Cluster buying: what happened when several insiders bought the same stockOriginal Research · September 29, 2026
- The insider buy/sell ratio: the weeks insiders called the market, and the crashes they missedOriginal Research · September 29, 2026
- The microcap trap: falling knives, insider selling and the rules that did not payOriginal Research · September 29, 2026