 StockDrifts
Q2 2026: where the top-rated 13F funds are overweight, and where they are not
763 four- and five-star funds hold $2.70tn across their top-50 positions. Set against 3,363 bottom-rated funds, their books lean on semiconductors, tobacco, disk drives and power producers, and away from REITs, insurers, exchanges and packaged food. The tilts hold at the industry, sector, market-cap and single-stock level.
Semiconductors, share of the book
23.5% vs 7.9%
Top-rated vs bottom-rated funds
Largest overweight
5.5x
Tobacco: 2.0% of elite dollars vs 0.4%
Technology sector
40% vs 23%
Finance runs the other way: 8% vs 20%
Names held mostly by top-rated funds
52
60%+ of holders top-rated, against a 19% baseline
The reading in 30 seconds
- Chips are the tilt. Semiconductors are 23.5% of top-rated funds' disclosed dollars and 7.9% of bottom-rated funds', and 60% of top-rated funds hold 5% or more of their book in the industry against 24% of the crowd. The ten largest industries are 62% of the elite book and 44% of the crowd's.
- The overweights are more specific than "tech". Tobacco (5.5x the crowd's weight, PM, BTI, MO), computer hardware (4.8x, WDC, STX, SNDK) and independent power producers (2.9x, CEG, TLN, VST) lead the list. The underweights are the crowd's comfort holdings: REITs, life and diversified insurers, exchanges, packaged foods, waste management.
- 52 stocks have holder lists that are 60% or more top-rated funds, against a 19% baseline. Tower Semiconductor, Hut 8, TTM Technologies, Talen Energy and Silicon Motion lead. The crowd's own favourites, where top-rated funds are under a tenth of holders, are Aon, Canadian National, Cintas, Becton Dickinson and ADP.
01 / By industry
What do the top funds invest in? A quarter of the book in chips, a twelfth for the crowd
Take every top-50 position of the 763 top-rated funds, label it with its industry, and add up the dollars. Then do the same for the 3,363 bottom-rated funds. The top-rated book is 23.5% semiconductors; the bottom-rated book is 7.9%. Internet content (9.1% vs 6.5%), infrastructure software, branded pharma and biotech follow. The elite book is also far more concentrated by industry: its ten largest industries hold 62% of its dollars against 44% for the crowd.
The crowd's book is heavier in the industries a diversified equity manager holds by default: credit services (Visa, Mastercard, Capital One) at 4.5% against 2.0%, diversified banks at 3.4% against 1.9%, consumer electronics (Apple) at 4.2% against 2.8%.
A reminder of what a three-year rating measures: the top-rated group is, by definition, the group whose disclosed books did best from mid-2023 to mid-2026, and semiconductors were the best-performing industry over that window. Some of this tilt is what winning looked like, not a choice made before the fact. The Q2 flow study shows the same funds were net sellers of chips in the quarter.
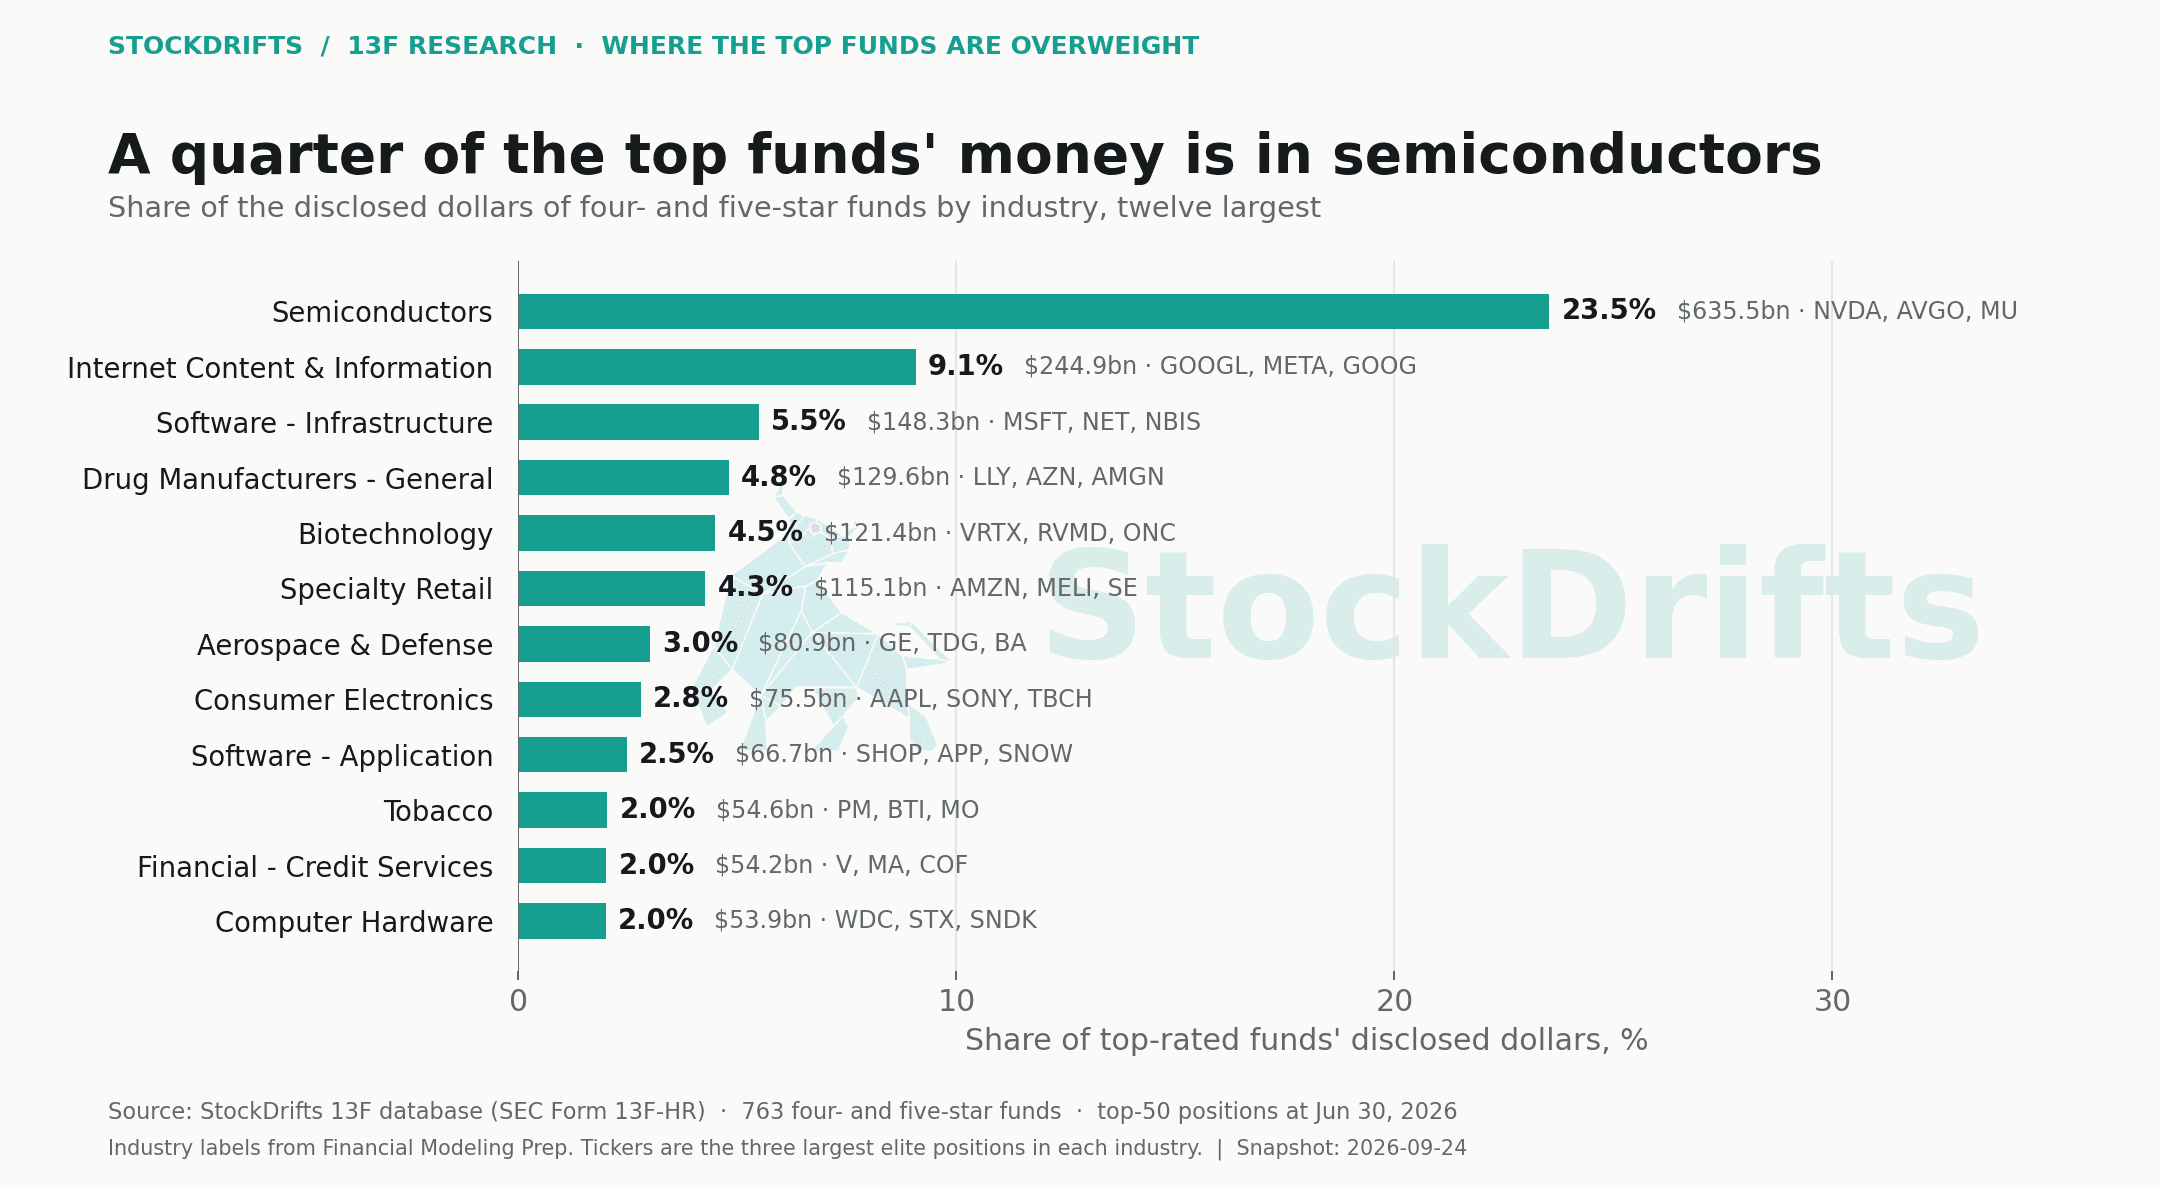
| Industry | Top-rated share | Bottom-rated share | Ratio | Elite dollars | Elite funds | Largest elite positions |
|---|---|---|---|---|---|---|
| Semiconductors | 23.5% | 7.9% | 3.0x | $635.5bn | 560 | NVDA, AVGO, MU |
| Internet Content & Information | 9.1% | 6.5% | 1.4x | $244.9bn | 498 | GOOGL, META, GOOG |
| Software - Infrastructure | 5.5% | 4.5% | 1.2x | $148.3bn | 526 | MSFT, NET, NBIS |
| Drug Manufacturers - General | 4.8% | 2.9% | 1.7x | $129.6bn | 327 | LLY, AZN, AMGN |
| Biotechnology | 4.5% | 2.2% | 2.0x | $121.4bn | 241 | VRTX, RVMD, ONC |
| Specialty Retail | 4.3% | 4.1% | 1.1x | $115.1bn | 475 | AMZN, MELI, SE |
| Aerospace & Defense | 3.0% | 2.6% | 1.1x | $80.9bn | 349 | GE, TDG, BA |
| Consumer Electronics | 2.8% | 4.2% | 0.7x | $75.5bn | 330 | AAPL, SONY, TBCH |
| Software - Application | 2.5% | 3.0% | 0.8x | $66.7bn | 406 | SHOP, APP, SNOW |
| Tobacco | 2.0% | 0.4% | 5.5x | $54.6bn | 62 | PM, BTI, MO |
| Financial - Credit Services | 2.0% | 4.5% | 0.4x | $54.2bn | 327 | V, MA, COF |
| Computer Hardware | 2.0% | 0.4% | 4.8x | $53.9bn | 285 | WDC, STX, SNDK |
| Hardware, Equipment & Parts | 1.9% | 1.0% | 1.9x | $50.5bn | 314 | APH, GLW, FLEX |
| Banks - Diversified | 1.9% | 3.4% | 0.6x | $50.3bn | 275 | JPM, BAC, C |
| Medical - Healthcare Plans | 1.6% | 1.4% | 1.1x | $44.3bn | 136 | UNH, CVS, CI |
| Auto - Manufacturers | 1.6% | 0.7% | 2.1x | $42.2bn | 196 | TSLA, GM, RIVN |
| Oil & Gas Exploration & Production | 1.2% | 1.2% | 1.0x | $32.6bn | 146 | CNQ, EOG, TPL |
| Engineering & Construction | 1.1% | 0.5% | 2.3x | $29.1bn | 196 | IESC, PWR, MTZ |
| Financial - Capital Markets | 1.1% | 1.0% | 1.0x | $29.1bn | 302 | HOOD, GS, SCHW |
| Industrial - Machinery | 1.1% | 1.8% | 0.6x | $28.6bn | 293 | GEV, SYM, PH |
02 / The overweights
Tobacco, disk drives, chips, power producers
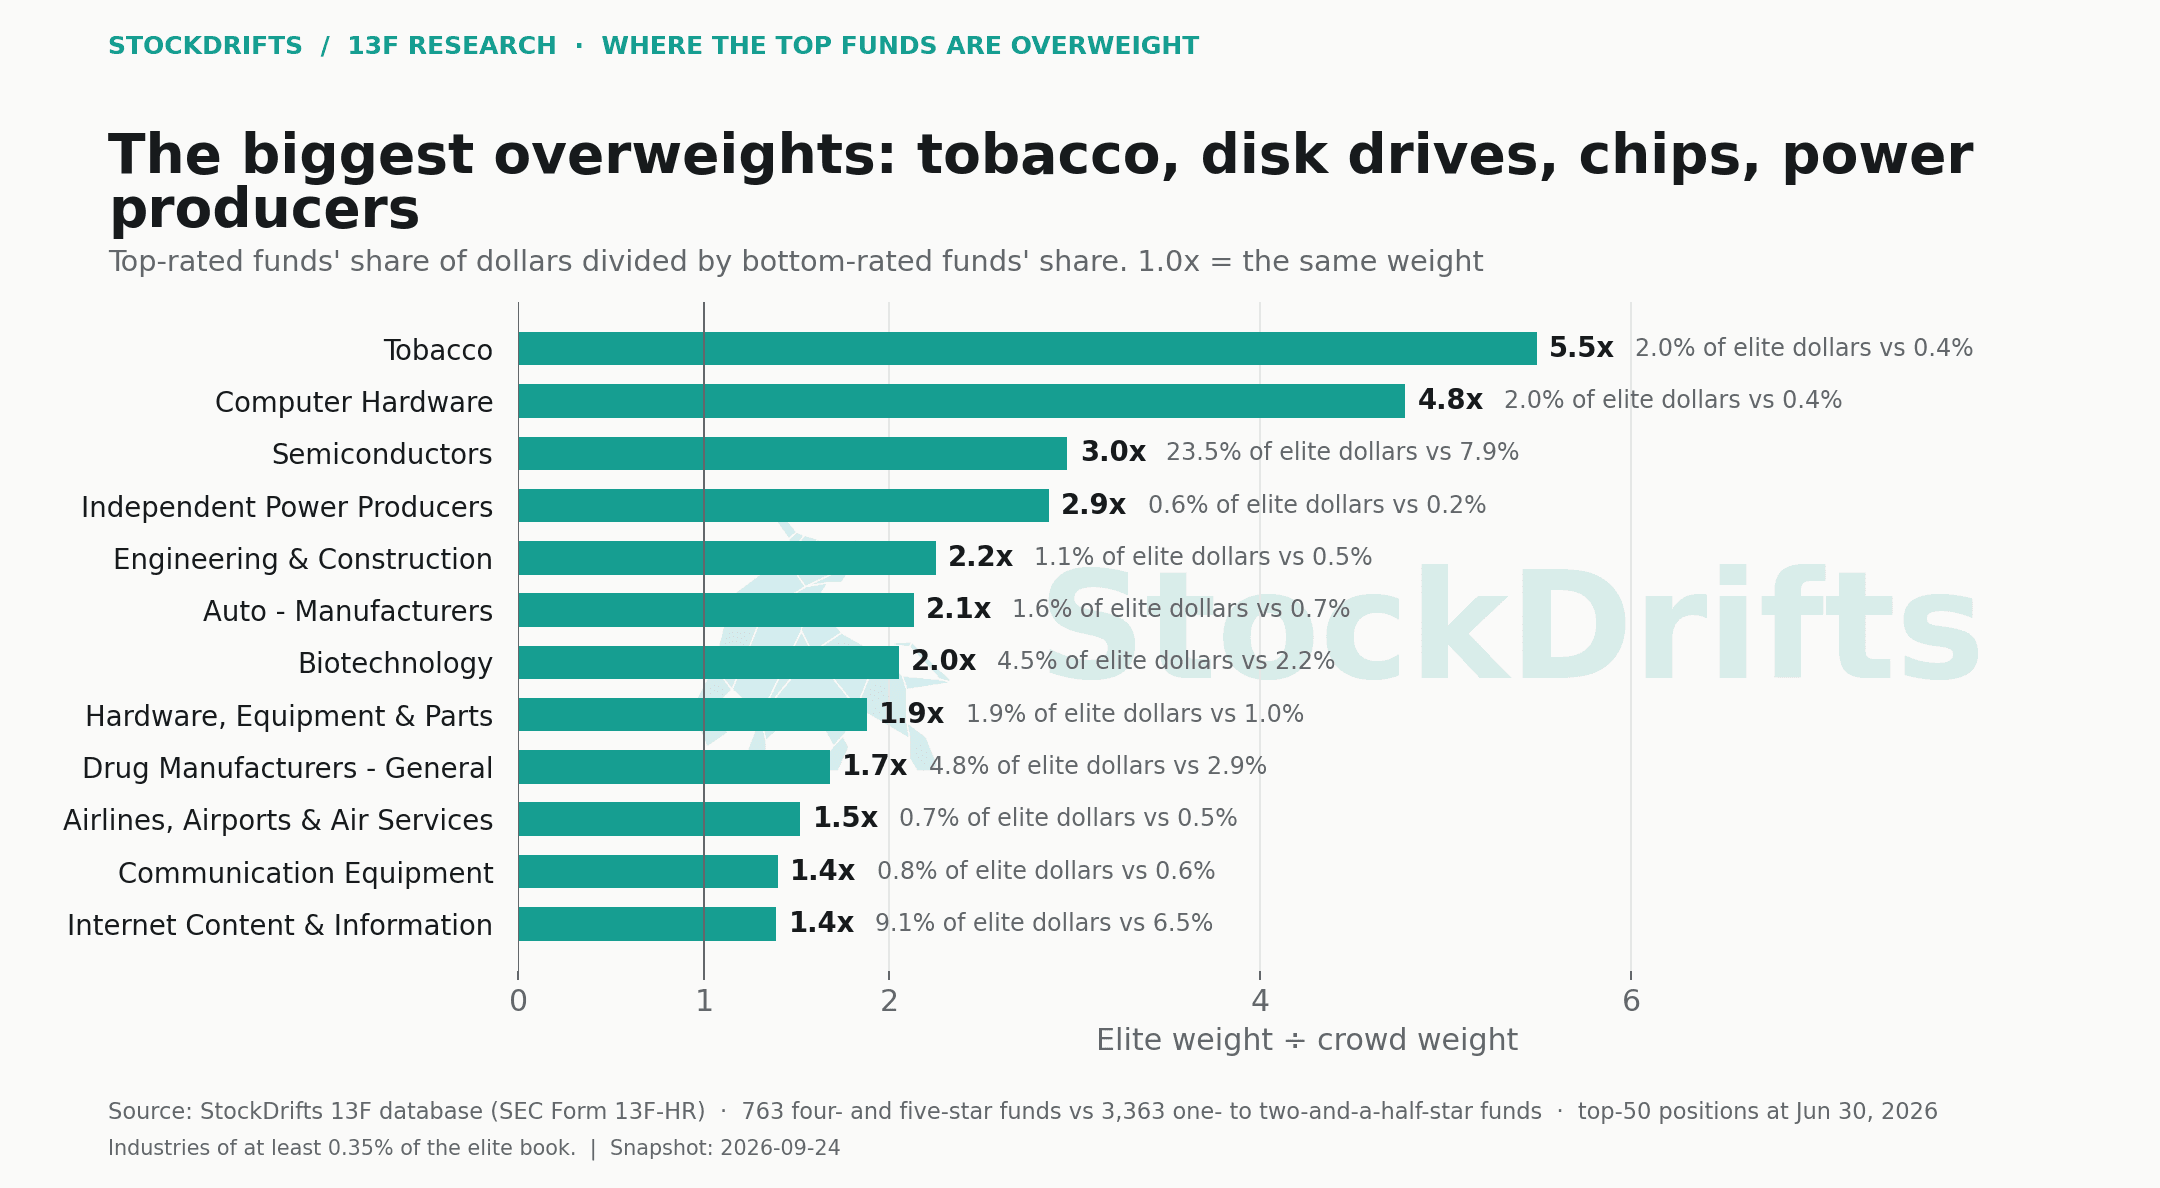
Divide the elite share by the crowd share and the largest overweights are not the largest industries. Tobacco is 5.5x: 2.0% of top-rated dollars against 0.4% for the crowd, $54.6bn across 62 funds, led by Philip Morris, British American Tobacco and Altria. Computer hardware is 4.8x, which in 2026 means the disk-drive and flash makers Western Digital, Seagate and Sandisk, $53.9bn across 285 funds. Semiconductors are 3.0x on a far larger base. Independent power producers (Constellation, Talen, Vistra) are 2.9x; engineering and construction (IES, Quanta, MasTec) 2.3x; auto manufacturers, which here is mostly Tesla, 2.1x; biotechnology 2.0x.
Three of those are the AI build-out one step removed from the chips: storage, power and the contractors who build data centers. Tobacco and biotech are not, and they are the tilts that would surprise a reader who assumed the top-rated funds were simply long the Nasdaq.
03 / The underweights
REITs, insurers, exchanges, staples
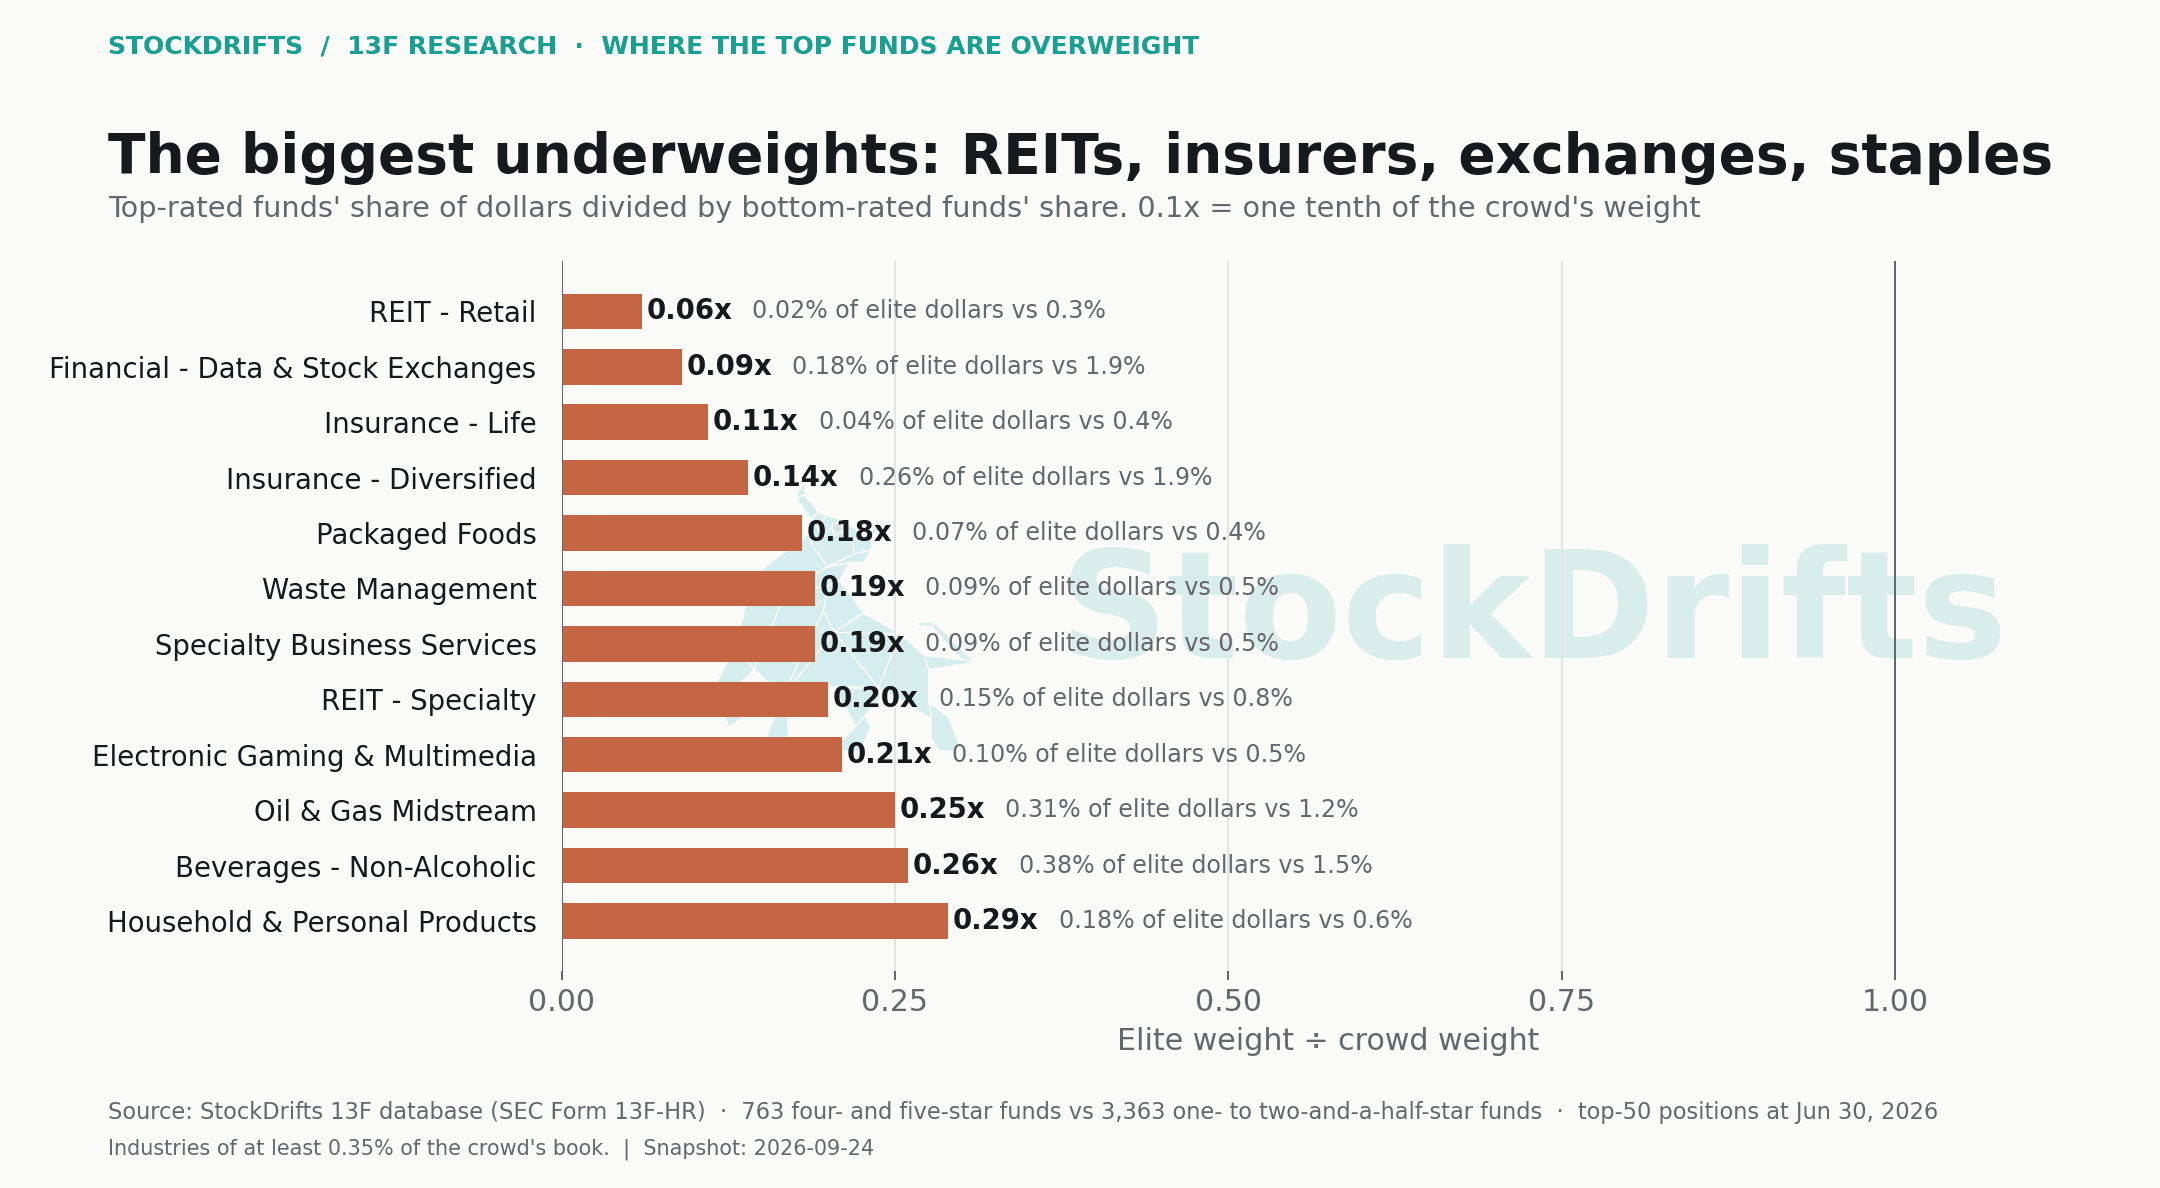
The other end of the ratio is where the crowd's money sits and the elite money does not. Retail REITs: 0.02% of the elite book against 0.3% of the crowd's, a ratio of 0.06x. Exchanges and data providers (CME, ICE, Coinbase): 0.09x. Life insurers 0.11x. Diversified insurance, which is mostly Berkshire Hathaway, 0.14x: 1,379 bottom-rated funds hold the industry, and it is 1.9% of their dollars against 0.26% of the elite's. Packaged foods, waste management, specialty REITs, midstream energy, soft drinks and household products complete the list.
These are the industries whose defining quality is stability. Over a three-year window in which the index rose two thirds and semiconductors several-fold, stability was what the bottom of the rating table owned.
04 / By sector
Technology 40% against 23%; Finance 8% against 20%
At the sector level the picture collapses to two numbers. Technology is 39.6% of the top-rated book and 23.2% of the crowd's; Finance is 8.0% against 19.5%. Health care, telecommunications (which carries Alphabet and Meta in this taxonomy) and consumer discretionary are close to even. Industrials, energy, materials, utilities and real estate are all lighter in the elite book.
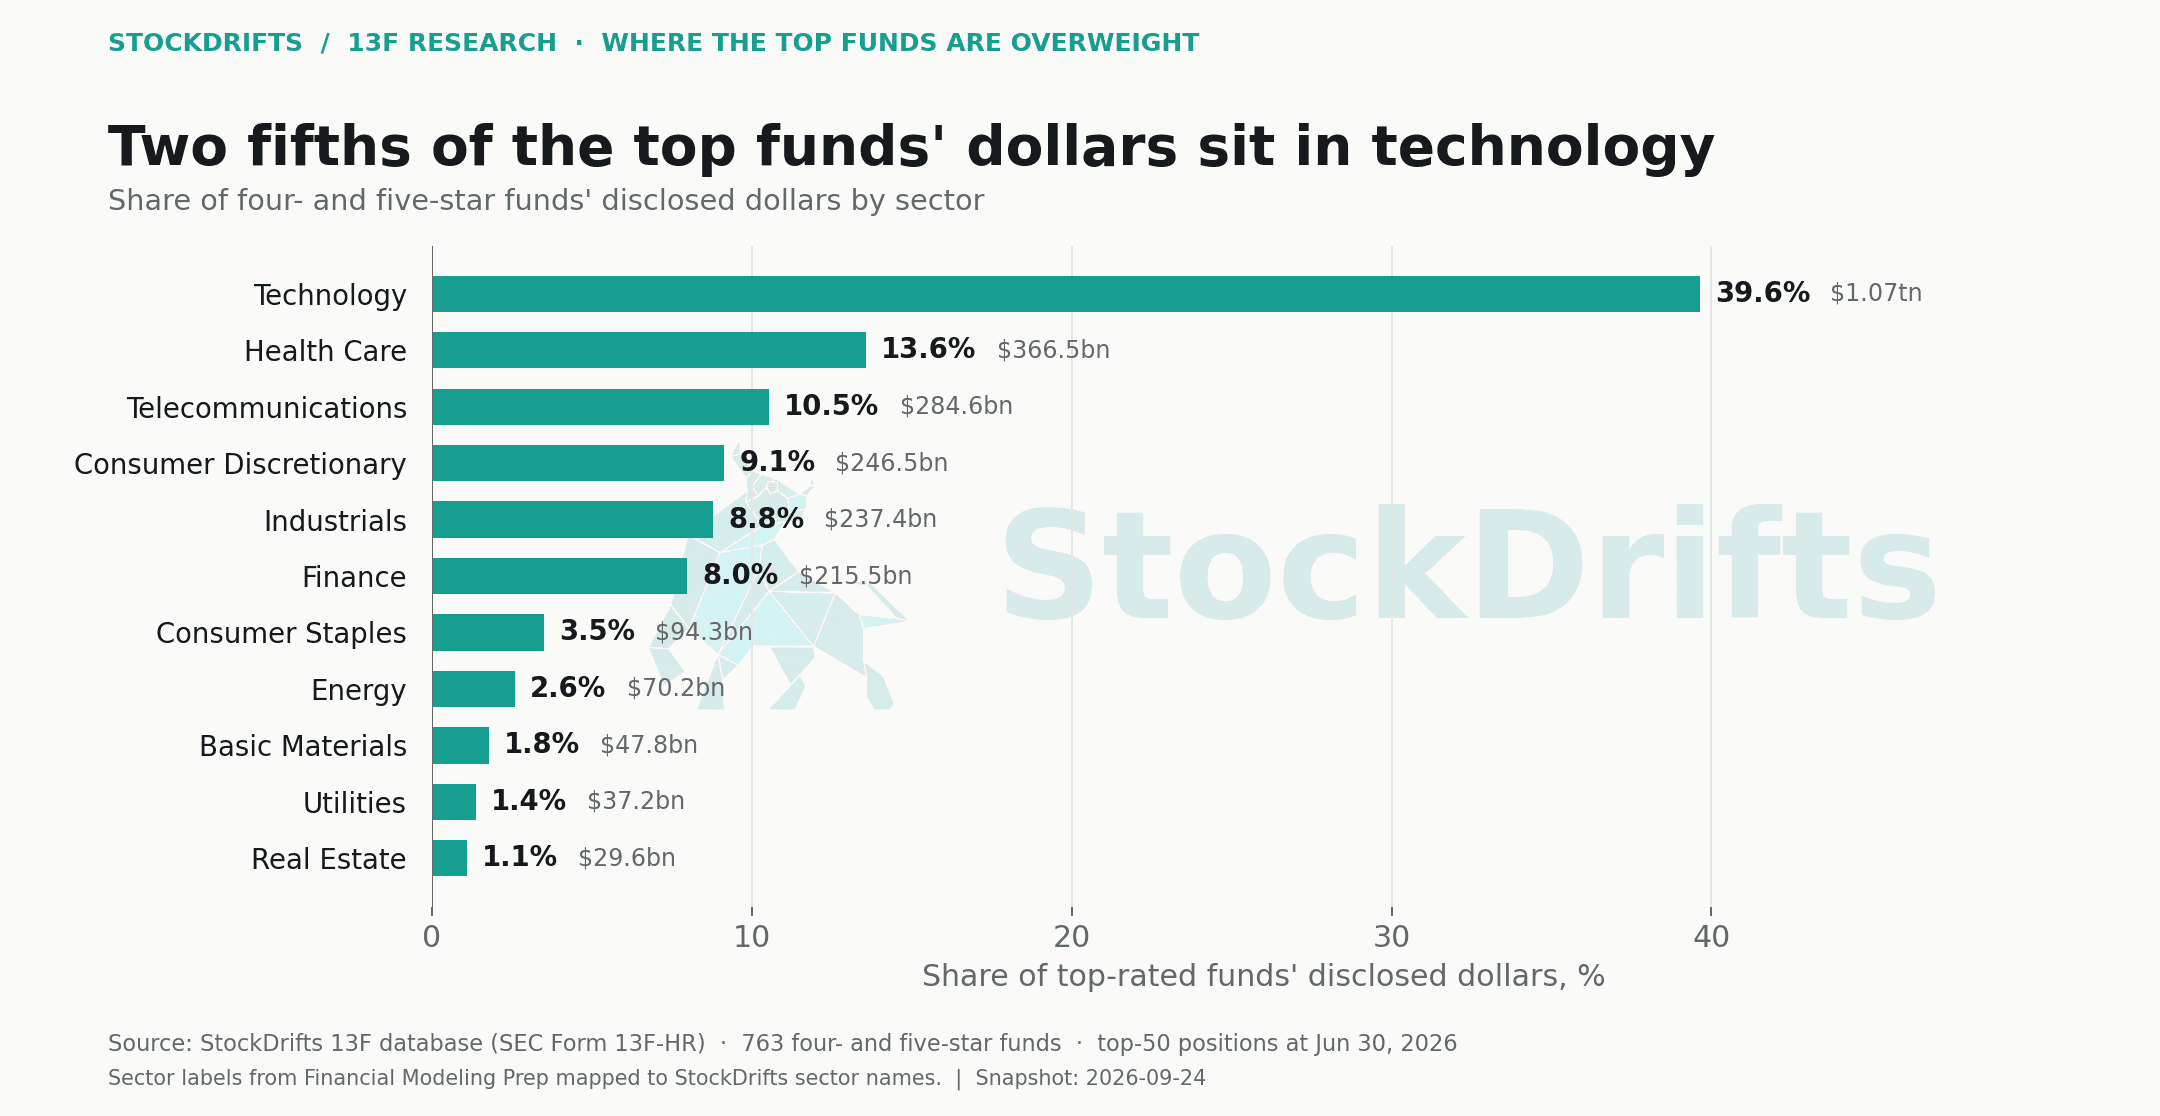
| Sector | Top-rated | Bottom-rated | All active funds | Ratio |
|---|---|---|---|---|
| Technology | 39.6% | 23.2% | 31.5% | 1.71x |
| Health Care | 13.6% | 11.7% | 12.1% | 1.16x |
| Telecommunications | 10.5% | 8.5% | 9.7% | 1.23x |
| Consumer Discretionary | 9.1% | 9.1% | 9.5% | 1.00x |
| Industrials | 8.8% | 10.9% | 9.5% | 0.81x |
| Finance | 8.0% | 19.5% | 14.1% | 0.41x |
| Consumer Staples | 3.5% | 4.3% | 3.8% | 0.81x |
| Energy | 2.6% | 4.5% | 3.6% | 0.58x |
| Basic Materials | 1.8% | 3.2% | 2.6% | 0.56x |
| Utilities | 1.4% | 1.8% | 1.6% | 0.76x |
| Real Estate | 1.1% | 3.1% | 1.9% | 0.35x |
05 / By market cap
Mega-cap dollars, smaller-cap positions
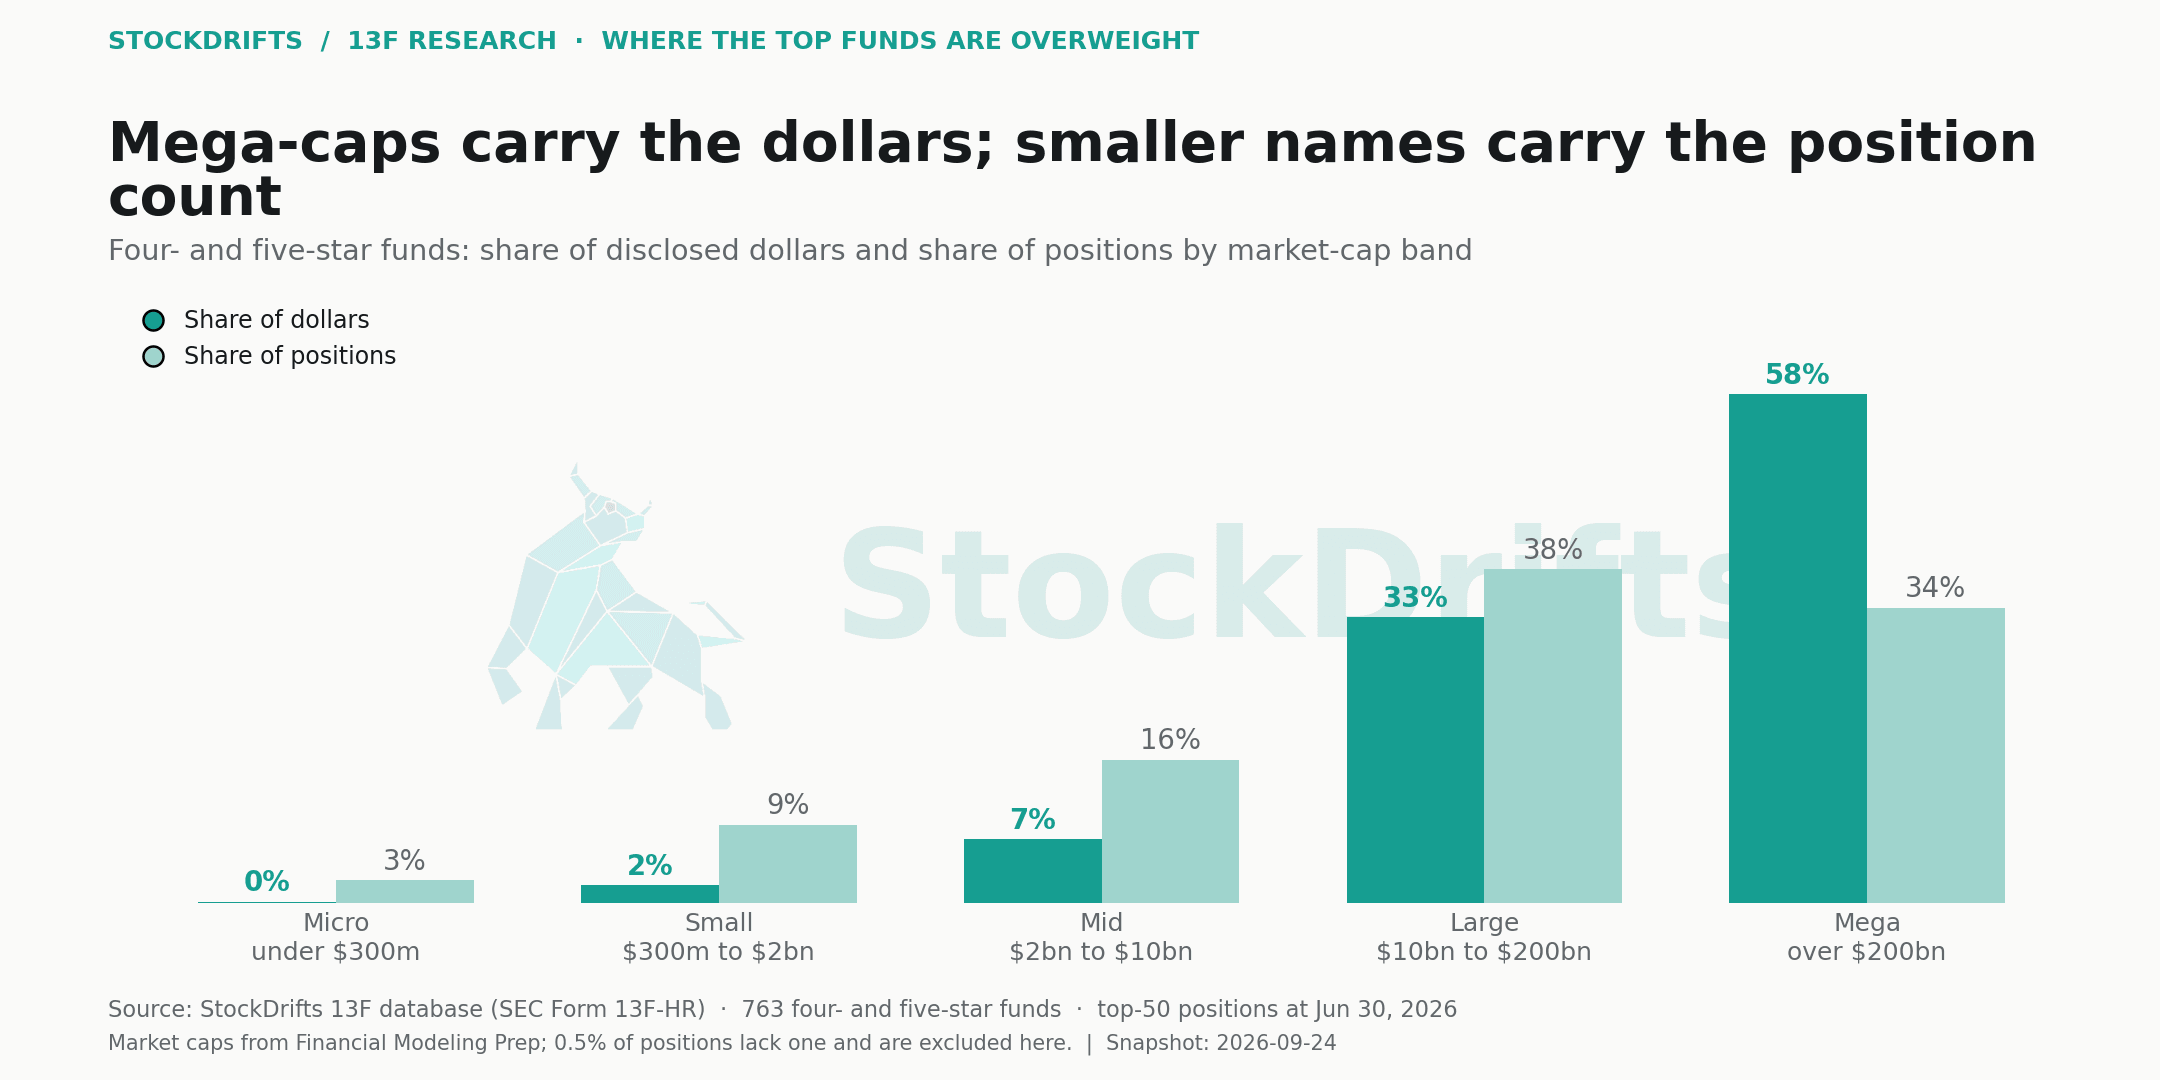
By dollars, the top-rated book is more mega-cap than the crowd's: 58% of elite dollars sit in companies above $200bn against 41% of the crowd's, because the elite's largest positions are Nvidia, Broadcom, Amazon, Microsoft and Micron. By position count the tilt reverses: 9% of elite positions are in small caps ($300m to $2bn) against 4% for the crowd, and 16% are mid caps against 10%. Top-rated funds hold more small and mid-cap names, sized small, under a few very large mega-cap positions.
06 / How many funds, not how many dollars
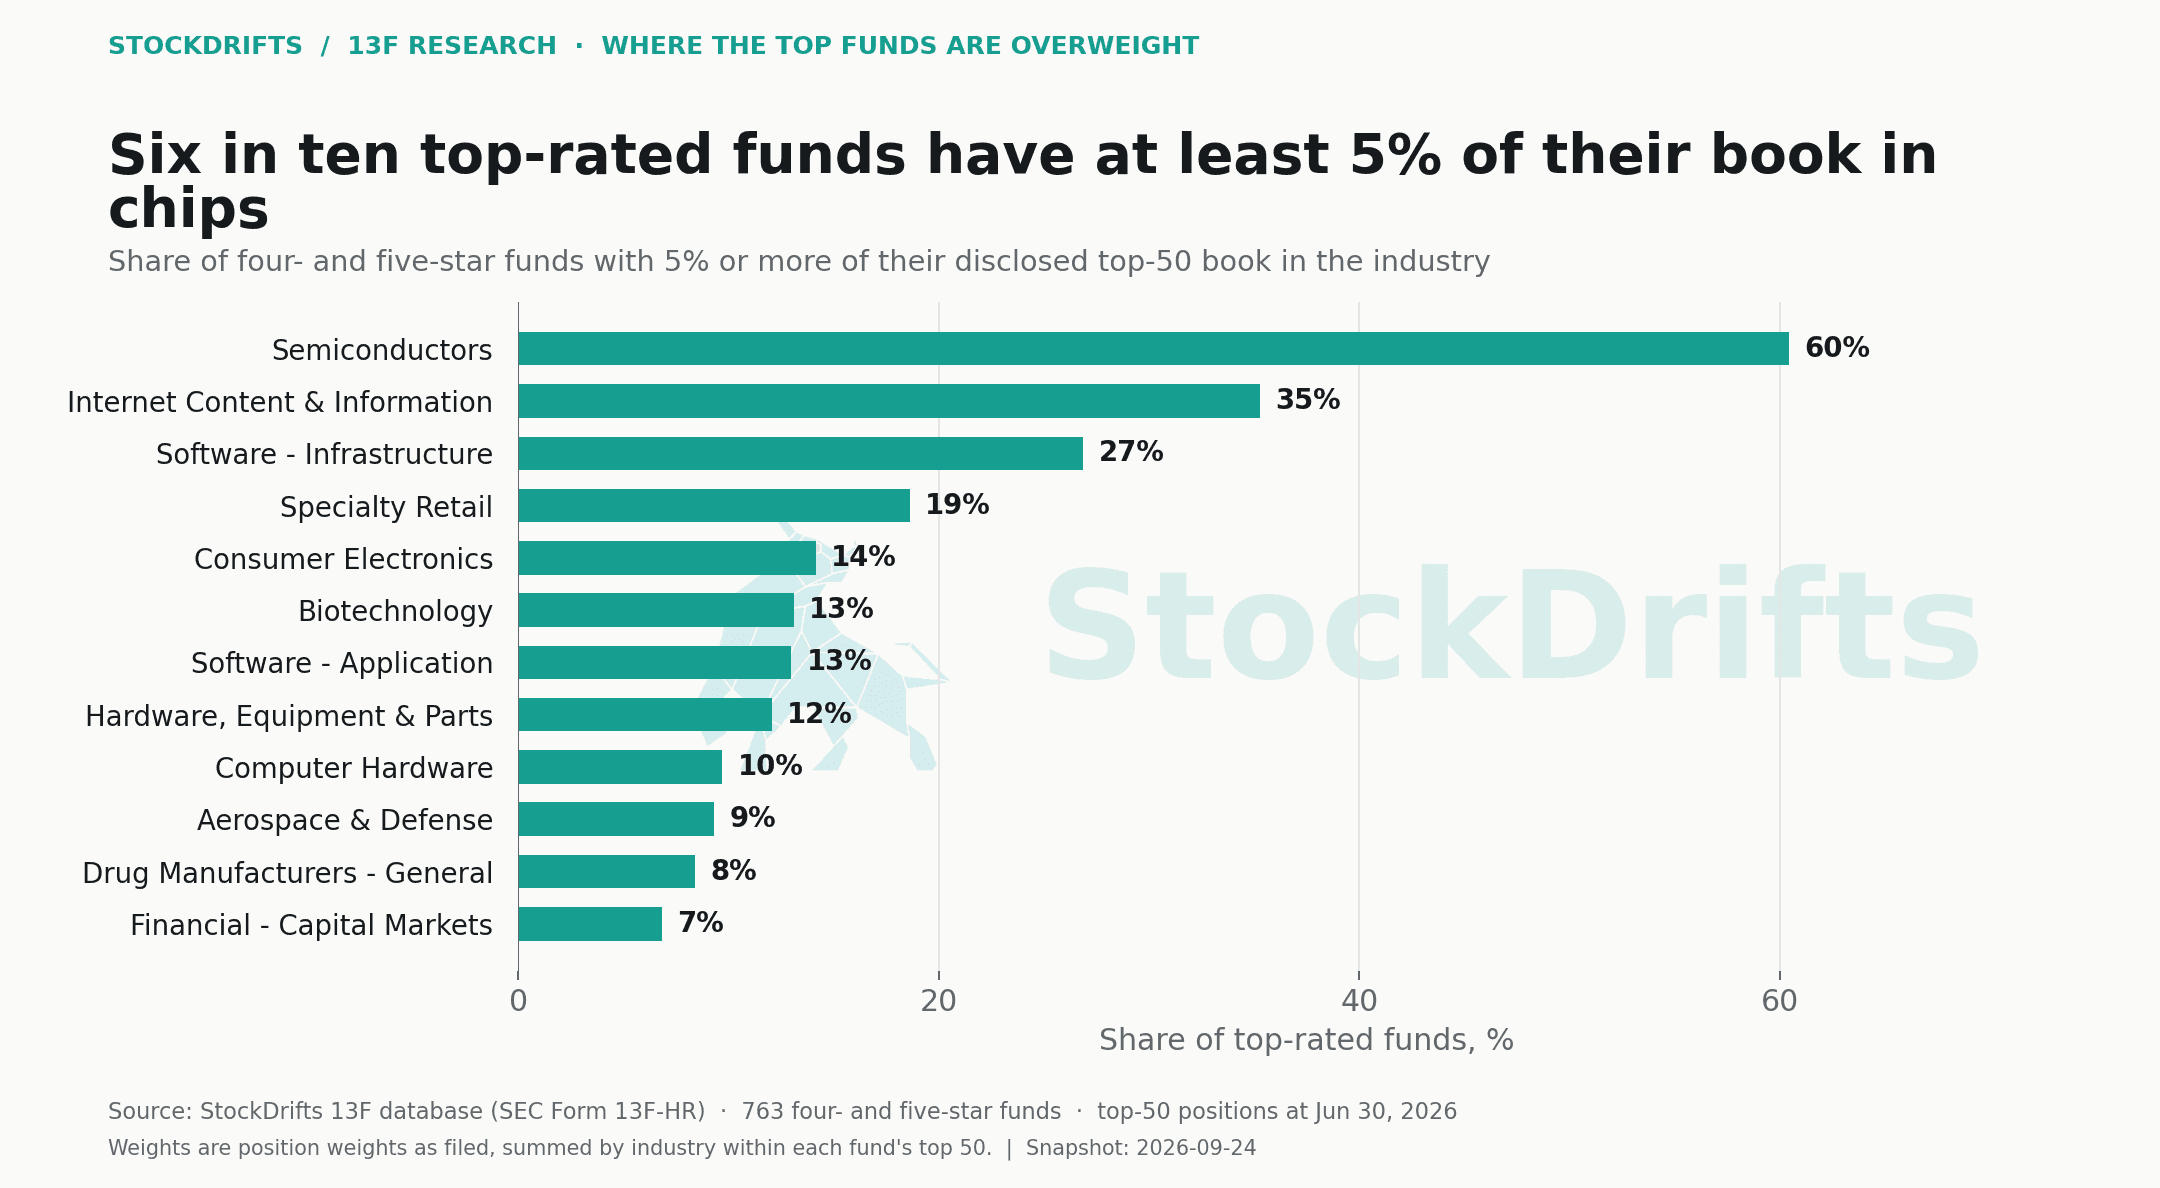
Six in ten top-rated funds have 5% or more in chips
Dollar shares can be driven by a few very large funds. A breadth measure asks how many funds in each group have a meaningful position in the industry: at least 5% of their top-50 book. 60% of top-rated funds clear that bar in semiconductors against 24% of the crowd. Internet content: 35% against 16%. Biotechnology: 13% against 4%. Computer hardware: 10% against 1%. The tilt is broad, not the work of a handful of large books.
07 / Single names
The smart-money stocks: names whose holders are mostly top-rated funds
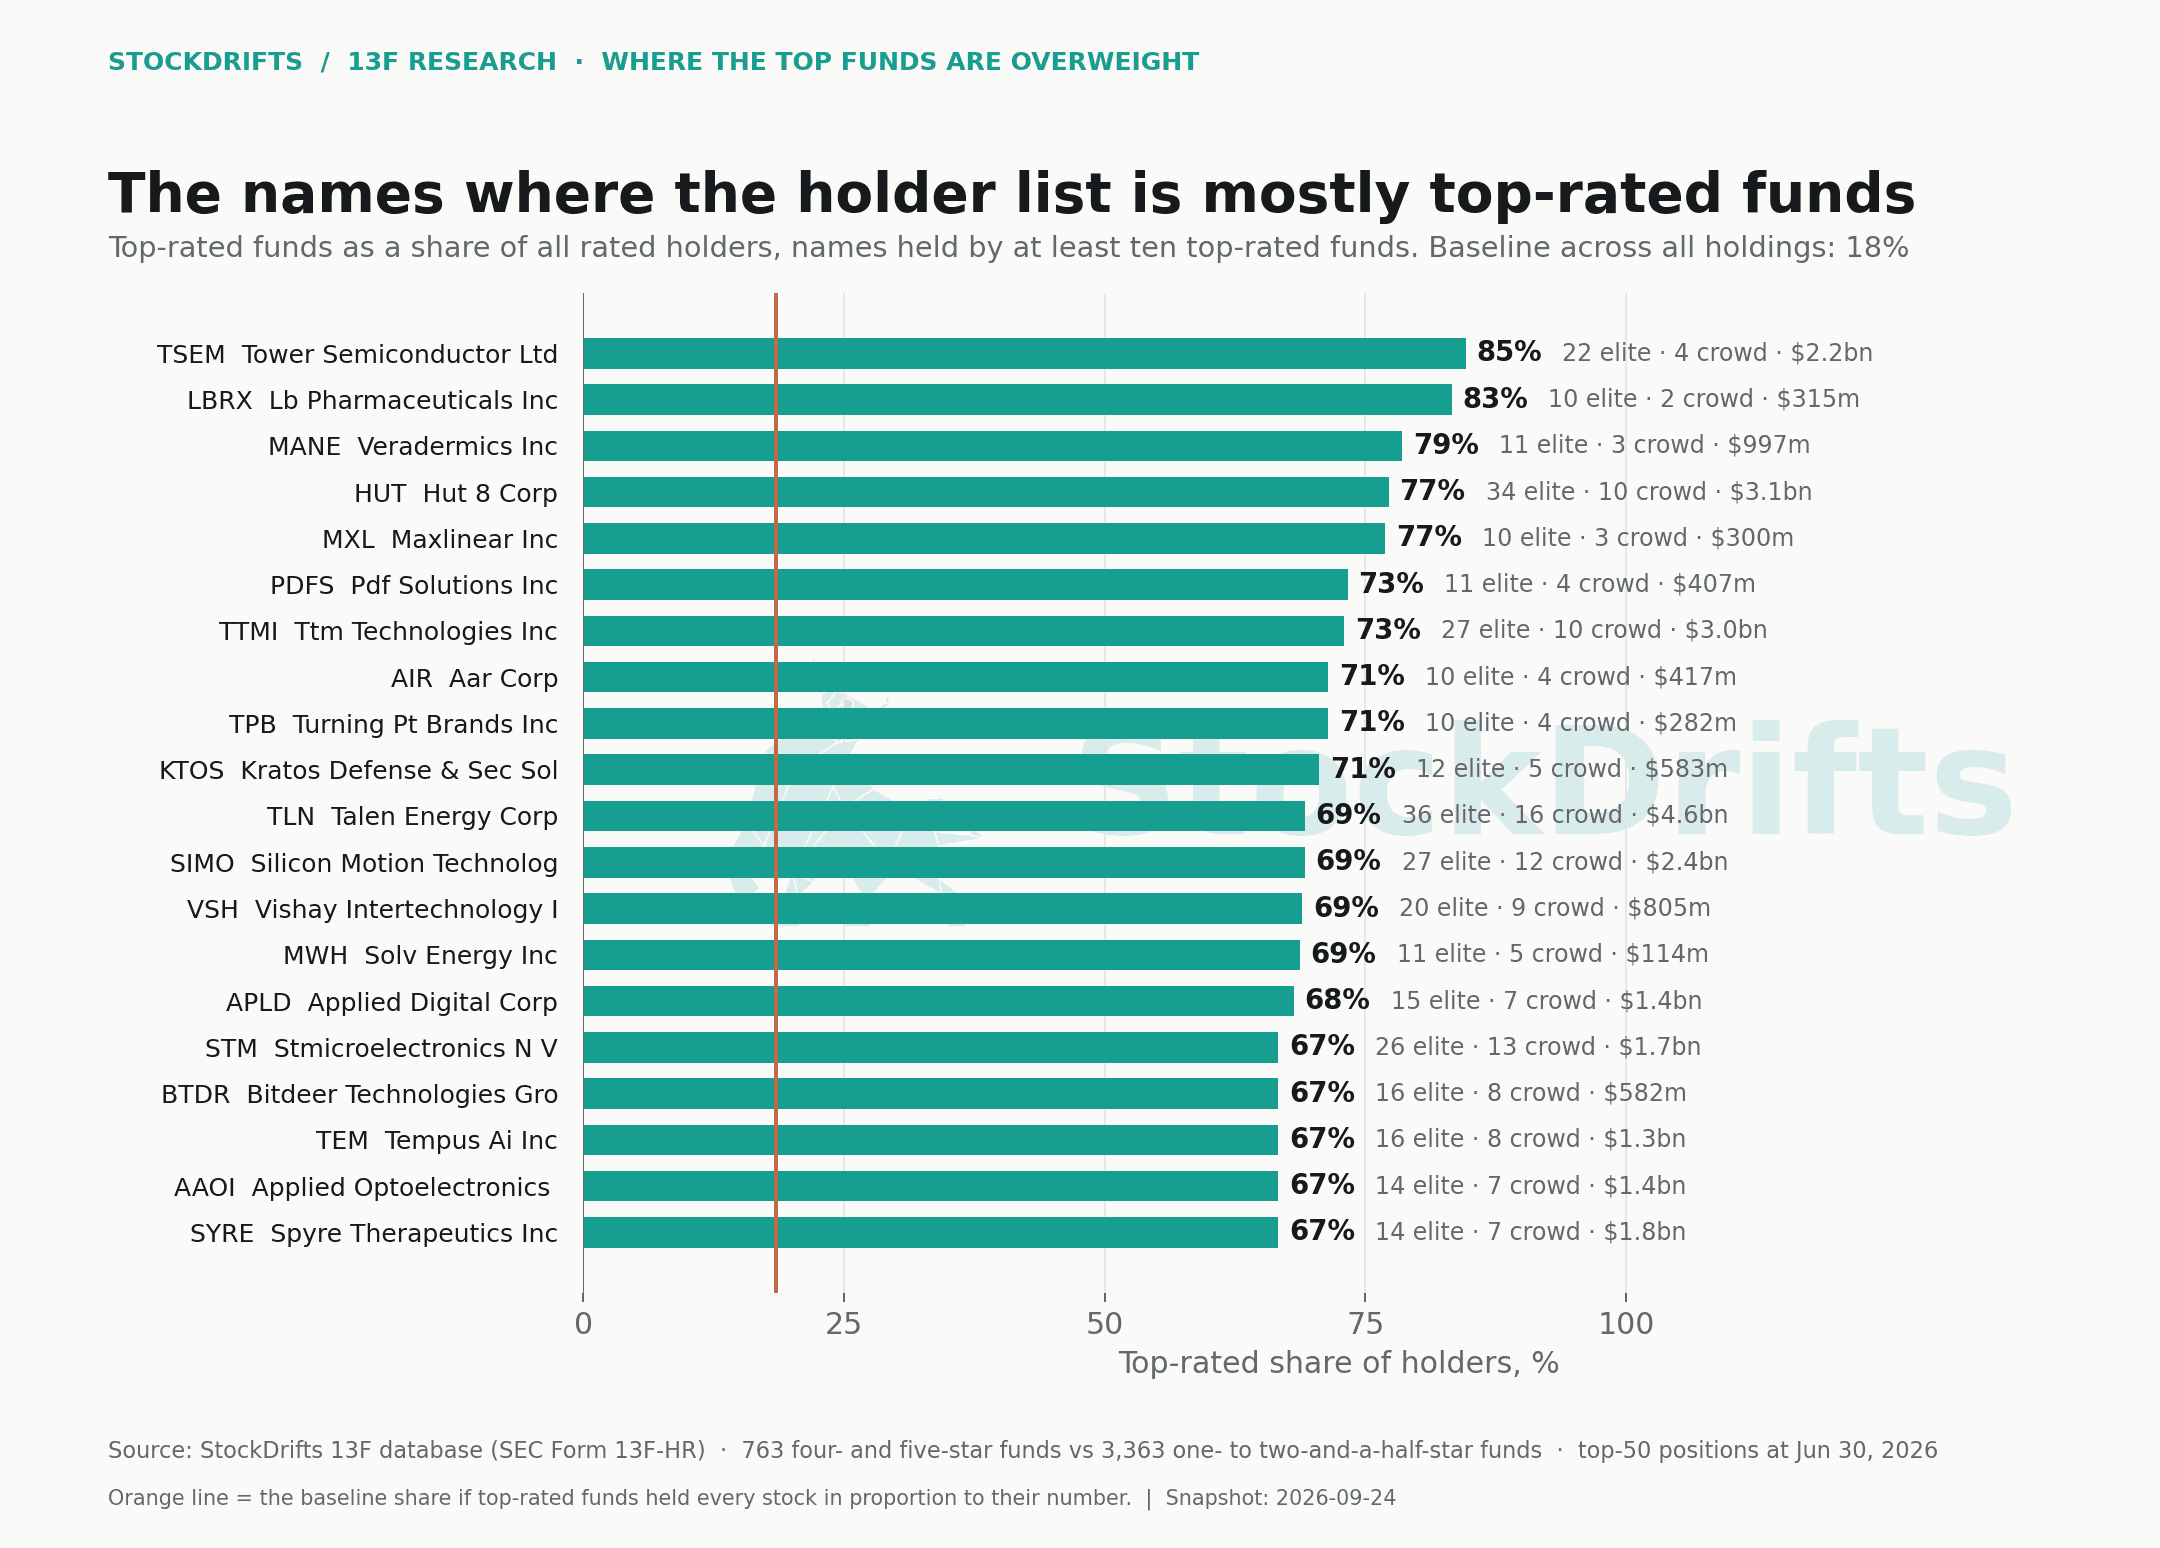
For each stock, count the top-rated and bottom-rated funds that hold it. Top-rated funds are 18.5% of the two groups combined, so a stock held in proportion would have a top-rated holder share near 19%. 52 stocks held by at least ten top-rated funds have a share of 60% or more. Tower Semiconductor leads at 85% (22 top-rated holders, 4 bottom-rated), then LB Pharmaceuticals, Veradermics, Hut 8 (34 vs 10), MaxLinear, PDF Solutions, TTM Technologies, AAR, Turning Point Brands, Kratos, Talen Energy (36 vs 16), Silicon Motion, Vishay, CoreWeave and Lumentum (56 vs 30, the most widely held name on the list).
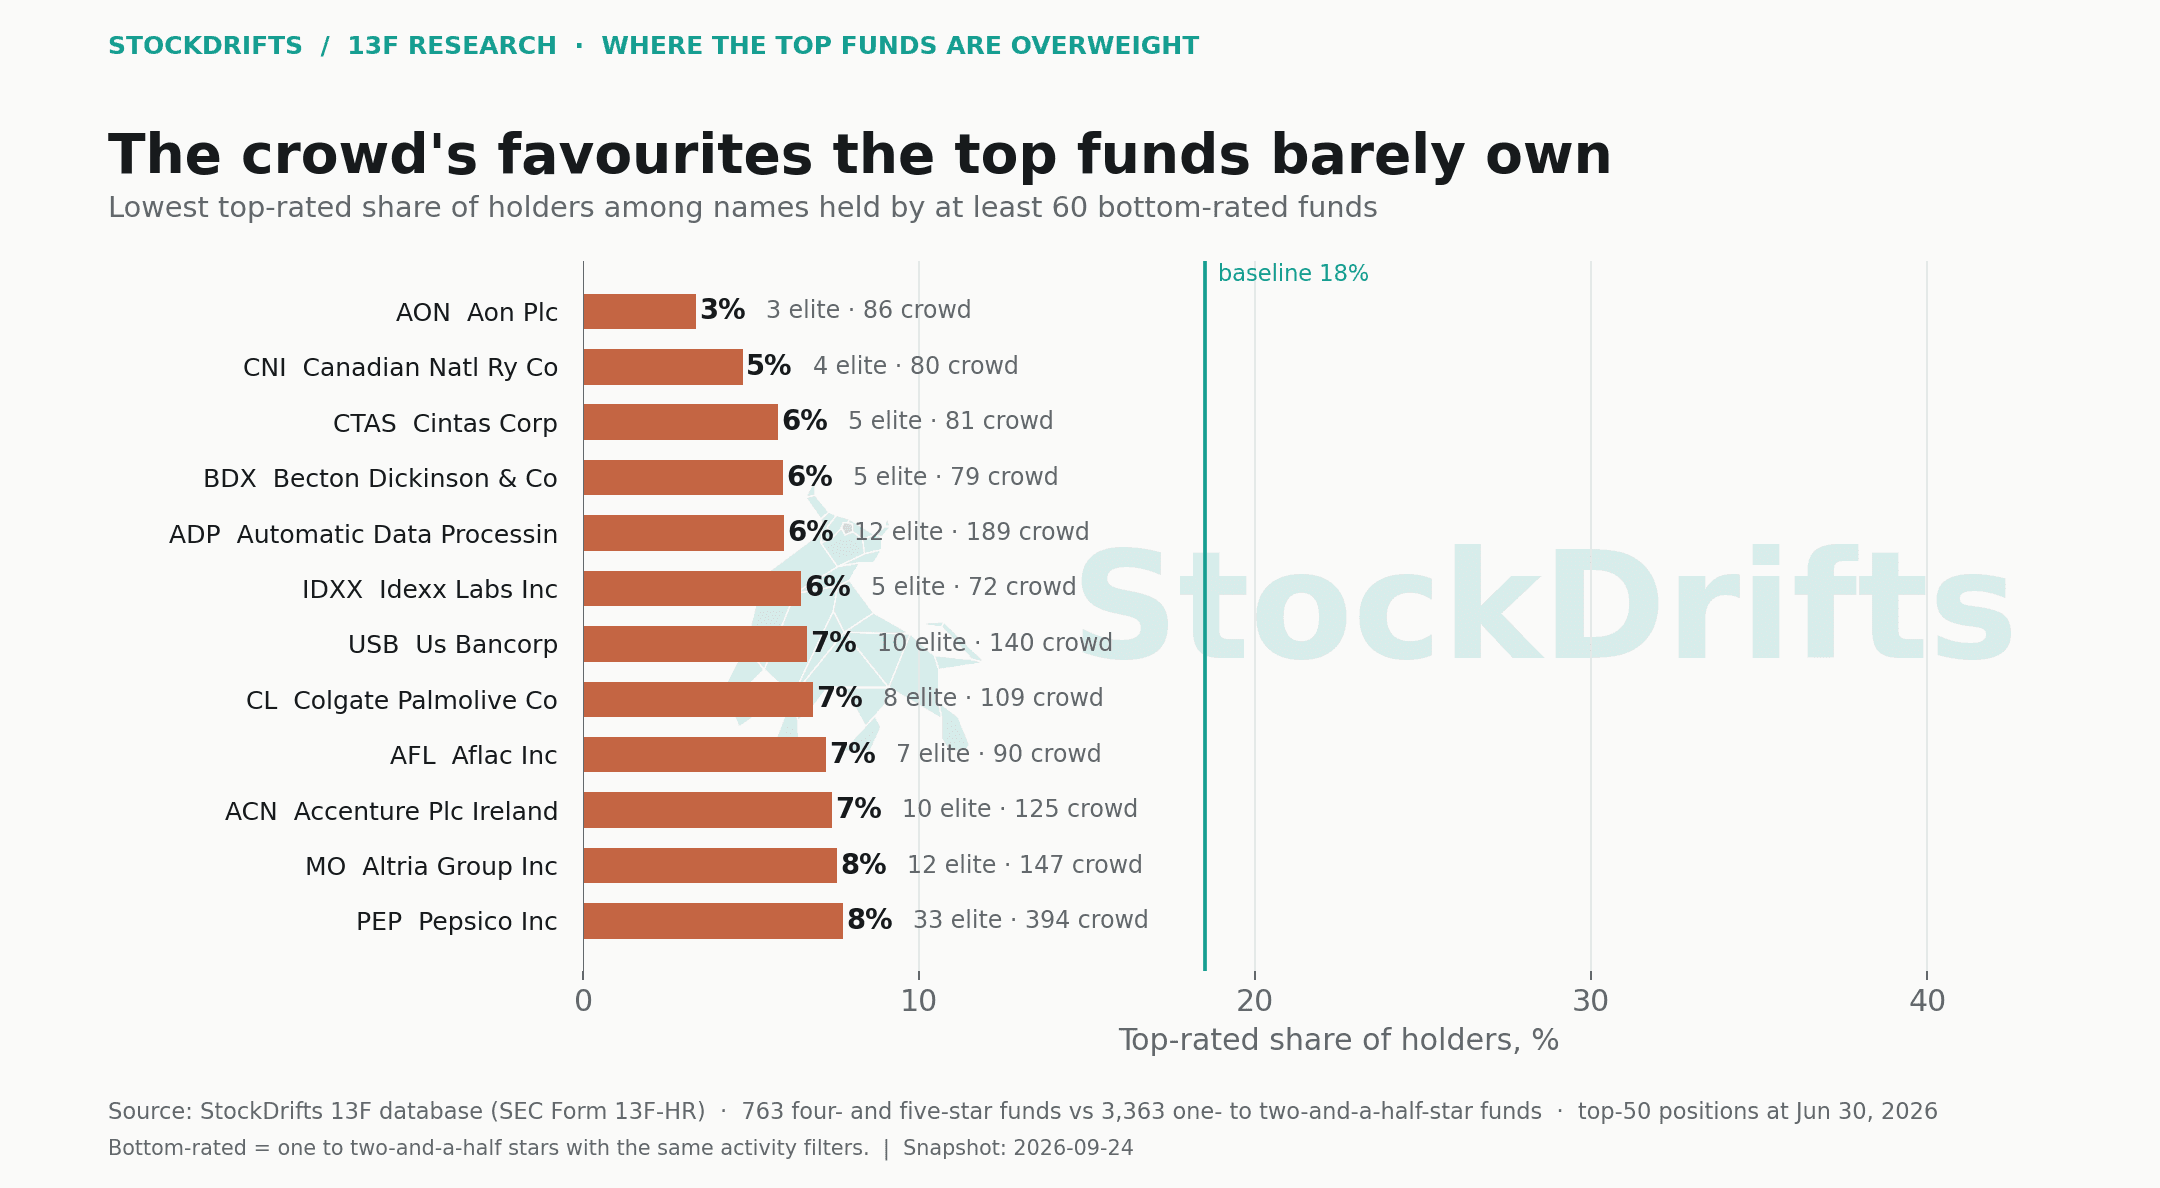
The pattern in the names is the pattern in the industries: foundry and analog chips, bitcoin miners turned data-center hosts, printed circuit boards, power, optical components, and a run of clinical-stage biotech. The crowd's equivalents, the names held by at least 60 bottom-rated funds where top-rated funds are under a tenth of holders, are Aon, Canadian National Railway, Cintas, Becton Dickinson, ADP, IDEXX, US Bancorp, Colgate, Aflac, Accenture, Altria, PepsiCo and Southern Company: quality compounders and dividend payers.
Neither list is a recommendation. The elite-tilted names include stocks that have already re-rated (the cost-basis study shows Tower Semiconductor's median top-rated holder up roughly 3x on cost) and the crowd-tilted names include some the top-rated funds may simply consider fully priced.
08 / What moved in the quarter
Money left the overweights
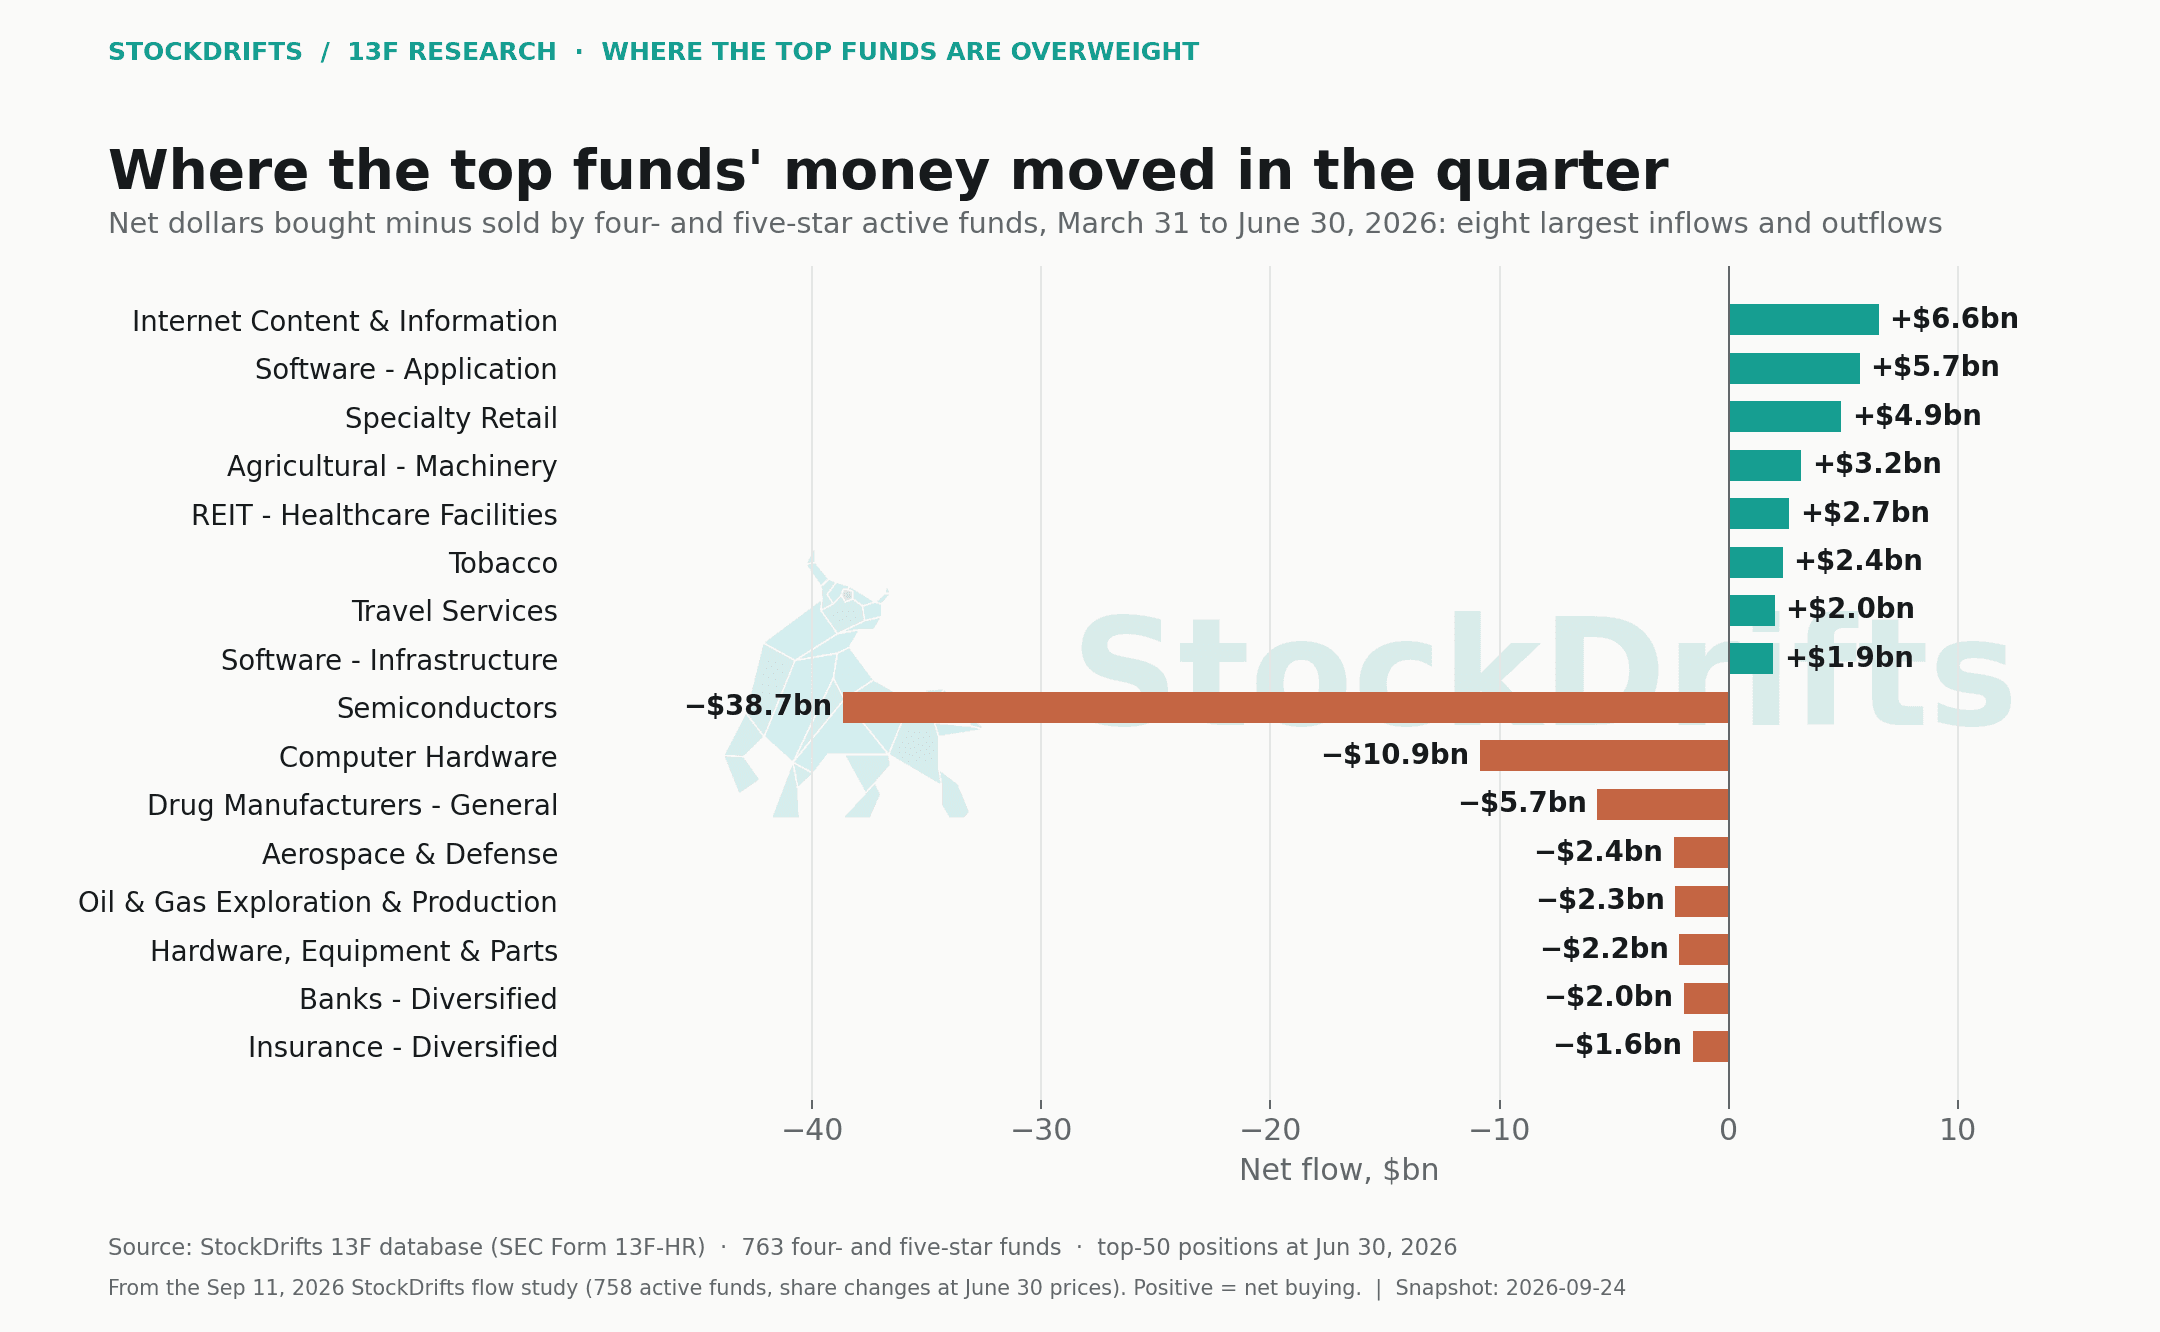
The StockDrifts Q2 2026 flow study measured what 758 active top-rated funds bought and sold between March 31 and June 30. Re-keyed to the industries here, the direction is one-way: the industries where the elite are overweight by 1.5x or more lost a net $59.6bn in the quarter, almost all of it semiconductors (−$38.7bn) and computer hardware (−$10.9bn); the underweight industries gained a net +$4.2bn; the industries in between gained +$18.8bn. The largest inflows went to internet content (+$6.6bn), application software (+$5.7bn), specialty retail, farm machinery and healthcare REITs. Tobacco, already the largest overweight, drew another +$2.4bn.
The positions in this article are a snapshot of where the money sat at June 30 after those trades. The tilt toward chips is what remained after a quarter of selling into a triple.
09 / Explore the evidence
Every stock, by holder group
Search 2,498 stocks held by at least five top-rated or bottom-rated funds. Elite share is the top-rated funds' share of the two groups' holders; the baseline is 18.5%.
Loading the table… · top-50 positions at June 30, 2026
| Stock | Top-rated holders | Bottom-rated holders | Elite share | Elite dollars | Crowd dollars | Elite median weight | Mkt cap $bn |
|---|
Nothing matches these filters.
10 / Methodology & limitations
Exactly what went into this study
The two groups. From the 5,251 active pickers in the StockDrifts universe (Q2 2026 filers with a rating, 12+ quarters, at most 1,000 positions, no index, custody, market-making, multi-manager, pension, insurance, sovereign or corporate filers), top-rated is four stars or better (763 funds with usable positions) and bottom-rated is two and a half stars or below (3,363 funds). The 981 three- and three-and-a-half-star funds are shown in the downloads but not in the comparisons.
The positions. Each fund's top 50 positions at June 30, 2026 as carried in the database: 24,753 elite rows and 82,932 crowd rows after removing ETFs, trust units, notes, warrants and preferreds, and after an implied-price guard that drops rows whose value-per-share differs by more than 2.5x from other holders of the same stock (convertibles filed under a stock's ticker, unit errors). The top 50 cover a median 82% of top-rated funds' disclosed value and 38% of bottom-rated funds'; dollar-weighted, 68% and 58%. Shares are shares of the dollars in those top-50 rows, so for the crowd, whose funds hold more names, the long tail of small positions is not counted.
Labels. Industry and sector from Financial Modeling Prep's taxonomy, with StockDrifts' ticker table as the fallback; 0.4% of positions are unclassified and excluded from the industry tables. Market caps from the same source.
Ratios. The elite share of dollars divided by the crowd share. Industry lists are restricted to industries of at least 0.35% of the relevant book so that a single small position cannot produce a large ratio. The breadth measure sums position weights by industry within each fund's top 50 and counts funds at or above 5%.
Elite share of holders. For each stock, distinct top-rated holders divided by distinct top-rated plus bottom-rated holders. The baseline, 18.5%, is the elite's share of funds across the two groups. Lists require at least ten top-rated holders (elite-tilted) or sixty bottom-rated holders (crowd-tilted).
The rating caveat. The top-rated group is selected on a three-year return that semiconductors dominated, so part of the chip tilt is the result of past performance rather than a current preference. Flows in the quarter, from the separate flow study, are shown to make that visible.
Sources. StockDrifts 13F database (SEC Form 13F-HR, all filers), snapshot September 24, 2026, filings through September 11, 2026; Q2 flows from the StockDrifts flow study of September 11, 2026. Scripts, intermediate tables and the summary file are published alongside this article.
11 / Questions
Questions this study answers
- What are hedge funds buying right now?
- The latest complete picture is the June 30, 2026 filings. Between March 31 and June 30, top-rated active funds put net money into internet content (+$6.6bn), application software (+$5.7bn), specialty retail, farm machinery, healthcare REITs and tobacco, and took net money out of semiconductors (−$38.7bn) and computer hardware (−$10.9bn). The flow study has the stock-level list. Form 13F is filed up to 45 days after quarter end, so "right now" means "as of the last quarter end".
- What do hedge funds invest in?
- By dollars in their top-50 positions, the top-rated 13F funds hold 23.5% in semiconductors, 9.1% in internet content, 5.5% in infrastructure software, 4.8% in branded pharmaceuticals and 4.5% in biotechnology. Technology is 40% of their books against 23% for bottom-rated funds, and 58% of their dollars sit in companies worth over $200bn.
- What are smart money stocks?
- "Smart money" usually means the positions of investors with a record of beating the market. Measured with 13F data, the smart-money stocks at June 30, 2026 are the 52 names whose holder list is at least 60% four- and five-star funds, against an 19% baseline: TSEM, LBRX, MANE, HUT, MXL, PDFS, TTMI, AIR, TPB, KTOS and the rest of section 7. The crowd's favourites that top-rated funds barely own are AON, CNI, CTAS, BDX, ADP, IDXX, USB, CL.
- Which sectors are hedge funds overweight in 2026?
- Relative to bottom-rated funds, top-rated 13F funds are overweight tobacco (5.5x the crowd's weight), computer hardware (4.8x), semiconductors (3.0x), independent power producers (2.9x) and engineering and construction, and underweight retail REITs, exchanges, life and diversified insurers, packaged foods and waste management. By sector: technology 40% vs 23%, finance 8% vs 20%.
- How can I find out what hedge funds are buying?
- Every institutional manager with $100m or more in US-listed securities files Form 13F with the SEC within 45 days of each quarter end, listing its long positions; the filings are public on EDGAR. Comparing a fund's filing with the previous one shows what it bought and sold. StockDrifts tracks every filer, rates them on the return of their disclosed book, and shows holdings, changes and estimated purchase prices on each investor page.
- What stocks do hedge funds avoid?
- Among widely held stocks, the names where top-rated funds are the smallest share of holders are AON, CNI, CTAS, BDX, ADP, IDXX, USB, CL: quality compounders and dividend payers held by dozens of bottom-rated funds each and a handful of top-rated ones. Section 7 has the list with counts.
This study describes disclosed positions and their past returns. It is not a recommendation to buy or sell any security, and past returns of a disclosed book are not a forecast of a fund's future returns.
More in this series
- Only 21% of active 13F funds beat the S&P 500 over five yearsOriginal Research · September 24, 2026
- Does a top 13F track record persist? About a third of it doesOriginal Research · September 24, 2026
- What the best 13F funds are losing on, and what they are up eightfold onOriginal Research · September 24, 2026
- What the best 13F funds owned before the AI crash, and whether they saw it comingOriginal Research · September 24, 2026
- How StockDrifts rates 13F funds: the star rating, the universe and the limits of the dataMethodology · September 24, 2026