 StockDrifts
What the best 13F funds are losing on, and what they are up eightfold on
24,746 positions at the top-rated funds, each compared with the price the fund is estimated to have paid. One in six sits below cost. Intuit, Boston Scientific, Salesforce and Pfizer lead the widely held losers; Micron's median holder is up 8x. The bigger the bet, the less often it is under water, and the crowd paid more than the elite for the same winners.
Top-rated positions below cost
16.1%
Of 24,746 positions · $173.7bn of $2.70tn
Median gain versus cost
+44%
31% of positions have more than doubled
Widely held stocks below cost
84 of 635
At June 30 · 118 at the September 24, 2026 close
Micron, median holder versus cost
+695%
243 top-rated holders · $96.0bn
The reading in 30 seconds
- 16.1% of top-rated funds' positions were below their estimated purchase price at June 30, 2026, almost the same as the 17.1% at bottom-rated funds. The difference between the groups is not fewer losers; it is larger winners, and larger positions in them.
- Size of bet predicts the outcome. Positions under 1% of a top-rated book are under water 20.5% of the time with a median gain of +31%; positions over 10% of the book are under water 9.8% of the time with a median gain of +110%. Among 5%-plus positions at investable funds, 9.1% are below cost and the median gain is +99%.
- The widely held losers cluster in application software, medical devices and payments: Intuit (−34% at the median holder), Boston Scientific (−33%), Salesforce (−28%, 45 holders), Pfizer, Adobe, ServiceNow, PayPal. Salesforce and ServiceNow have since recovered above cost; Intuit and Boston Scientific have not.
01 / The distribution
One position in six is under water, at the best funds and the worst
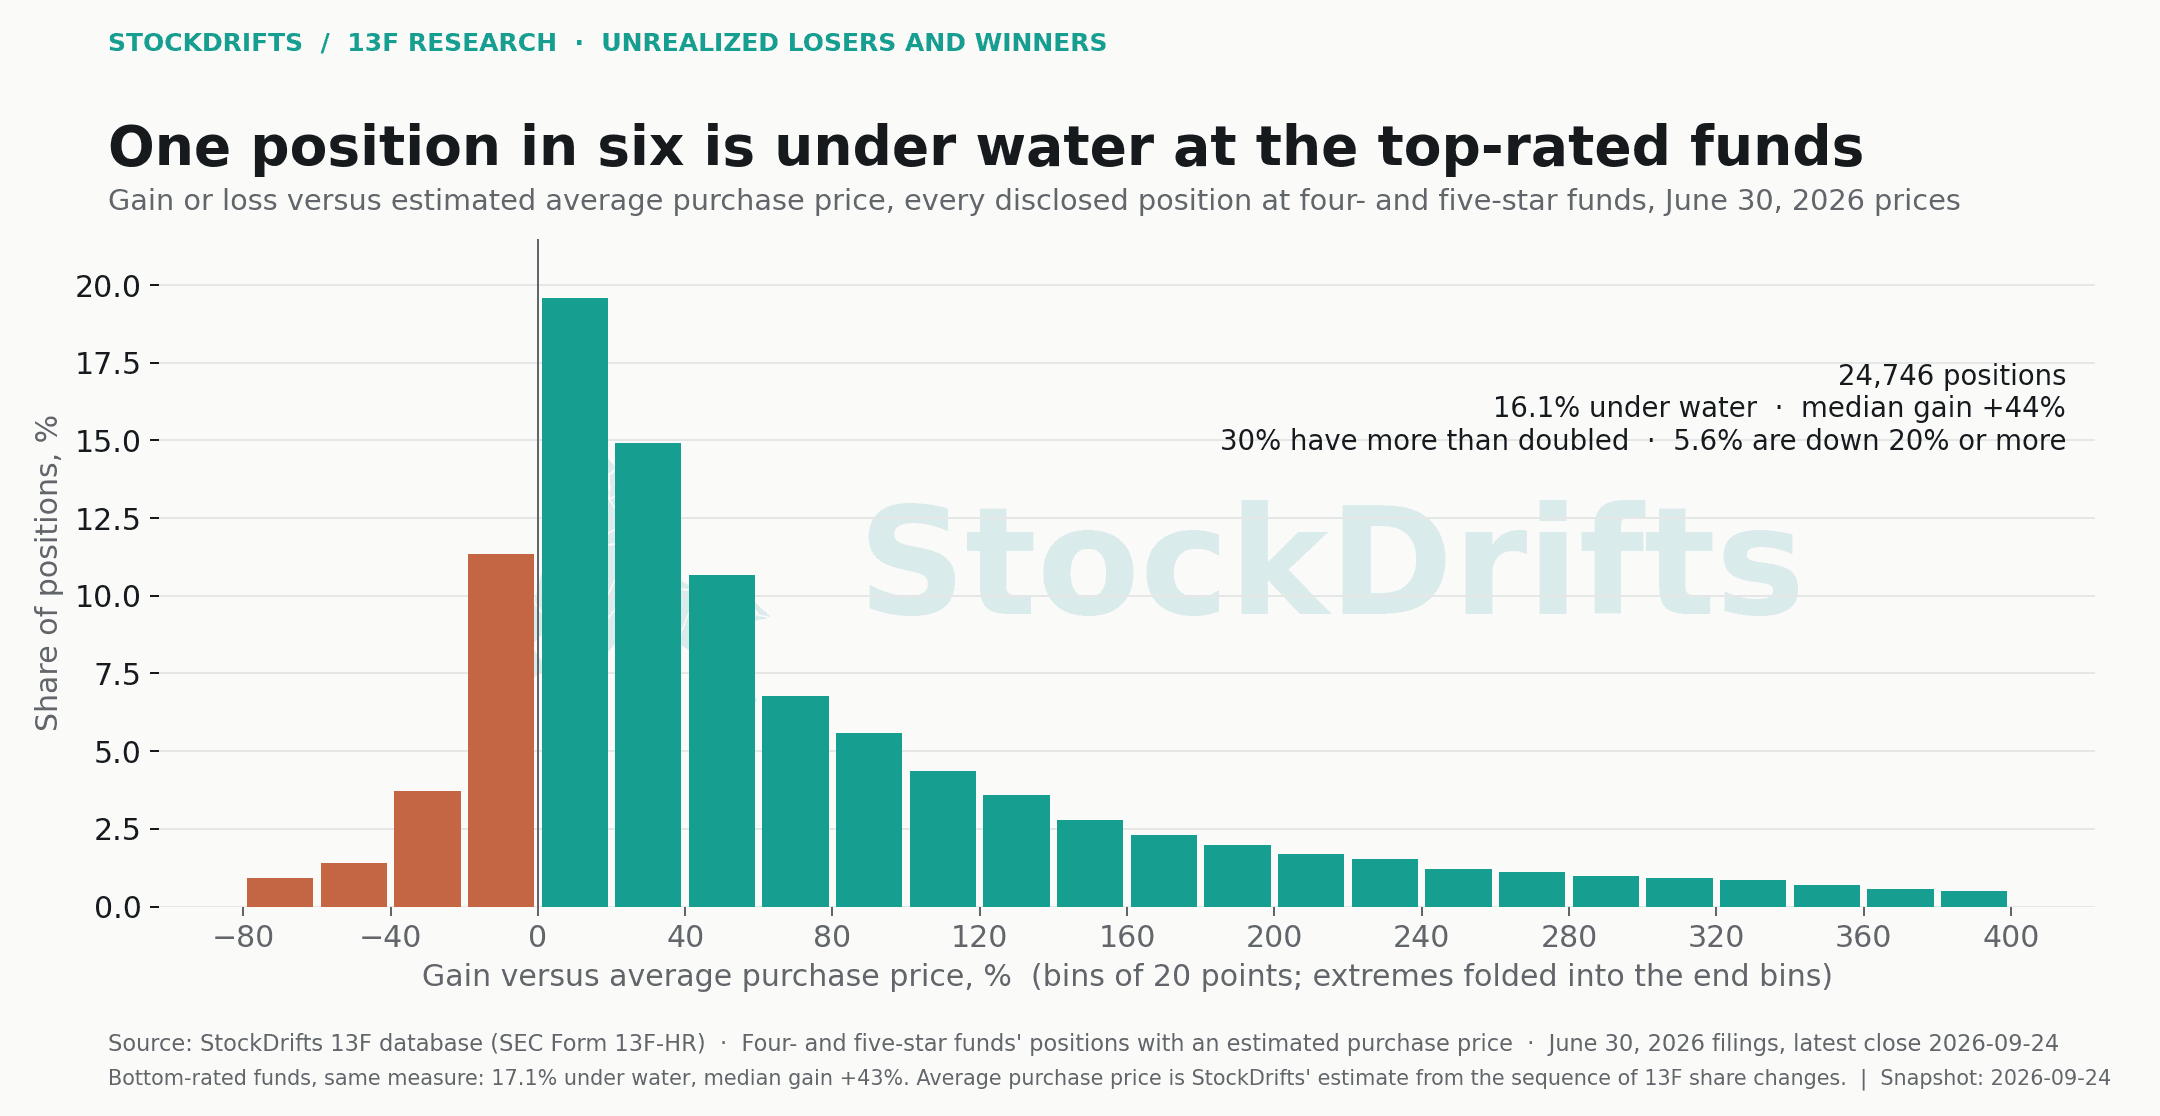
For every position in a fund's top 50 the database carries an estimated average purchase price. Divide the June 30 price by that estimate and each position has a gain or loss versus cost. Across the 24,746 positions at top-rated funds, 16.1% are below cost, the median position is up 44%, and 31% have more than doubled. The middle half runs from +9% to +128%. 5.6% are down 20% or more.
The bottom-rated funds' 82,836 positions look almost the same: 17.1% under water, median +43%, 29% doubled, middle half +8% to +118%. Two things separate the groups, and neither is the loss rate. The top-rated funds' upper tail is fatter (a 75th percentile of +128% against +118%), and, as the scorecard showed, the top-rated funds sized those winners larger.
In dollars, $173.7bn of the top-rated funds' $2.70tn in top-50 positions sits below cost, 6.4%. The dollar share is lower than the position share because the losing positions are, on average, the smaller ones.
02 / By size of bet
The bigger the bet, the less often it is under water
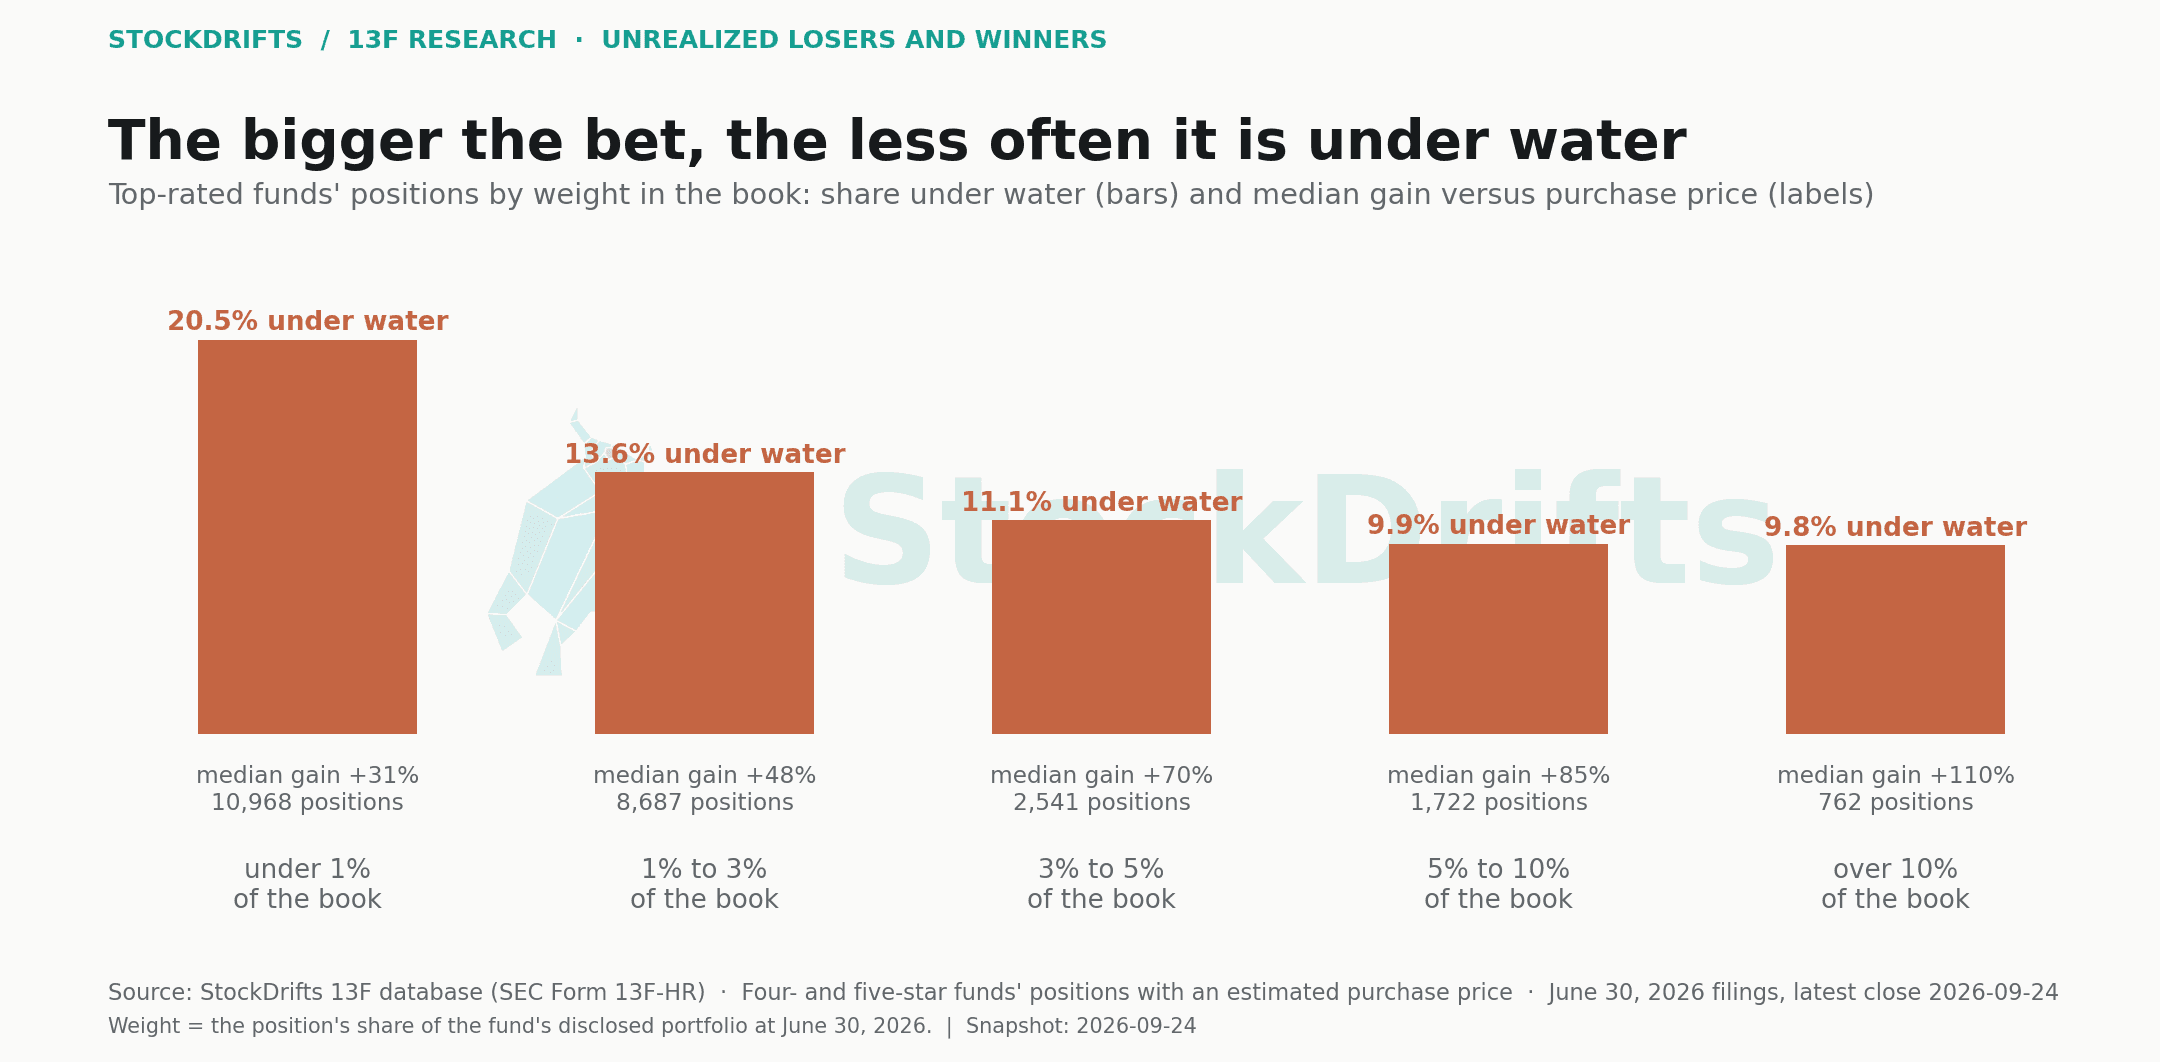
Sort the top-rated funds' positions by their weight in the book. Positions under 1% of the book: 20.5% under water, median gain +31%. One to three percent: 13.6% and +48%. Three to five: 11.1% and +70%. Five to ten: 9.9% and +85%. Over ten percent of the book: 9.8% under water and a median gain of +110%, with 52% of those positions more than doubled.
Part of this is arithmetic: a position that has tripled is, by that fact, a larger share of the book than it was when bought, so large weights and large gains go together. Part of it is not. The under-1% band holds the positions funds have been trimming, the new positions bought recently at recent prices, and the ones that fell. Either way, for a reader looking at a 13F, weight is the most useful single number on the page: a top-rated fund's 10% position was, at June 30, almost never a loss.
03 / The widely held losers
What are the top funds losing money on? Intuit, Boston Scientific, Salesforce, Pfizer
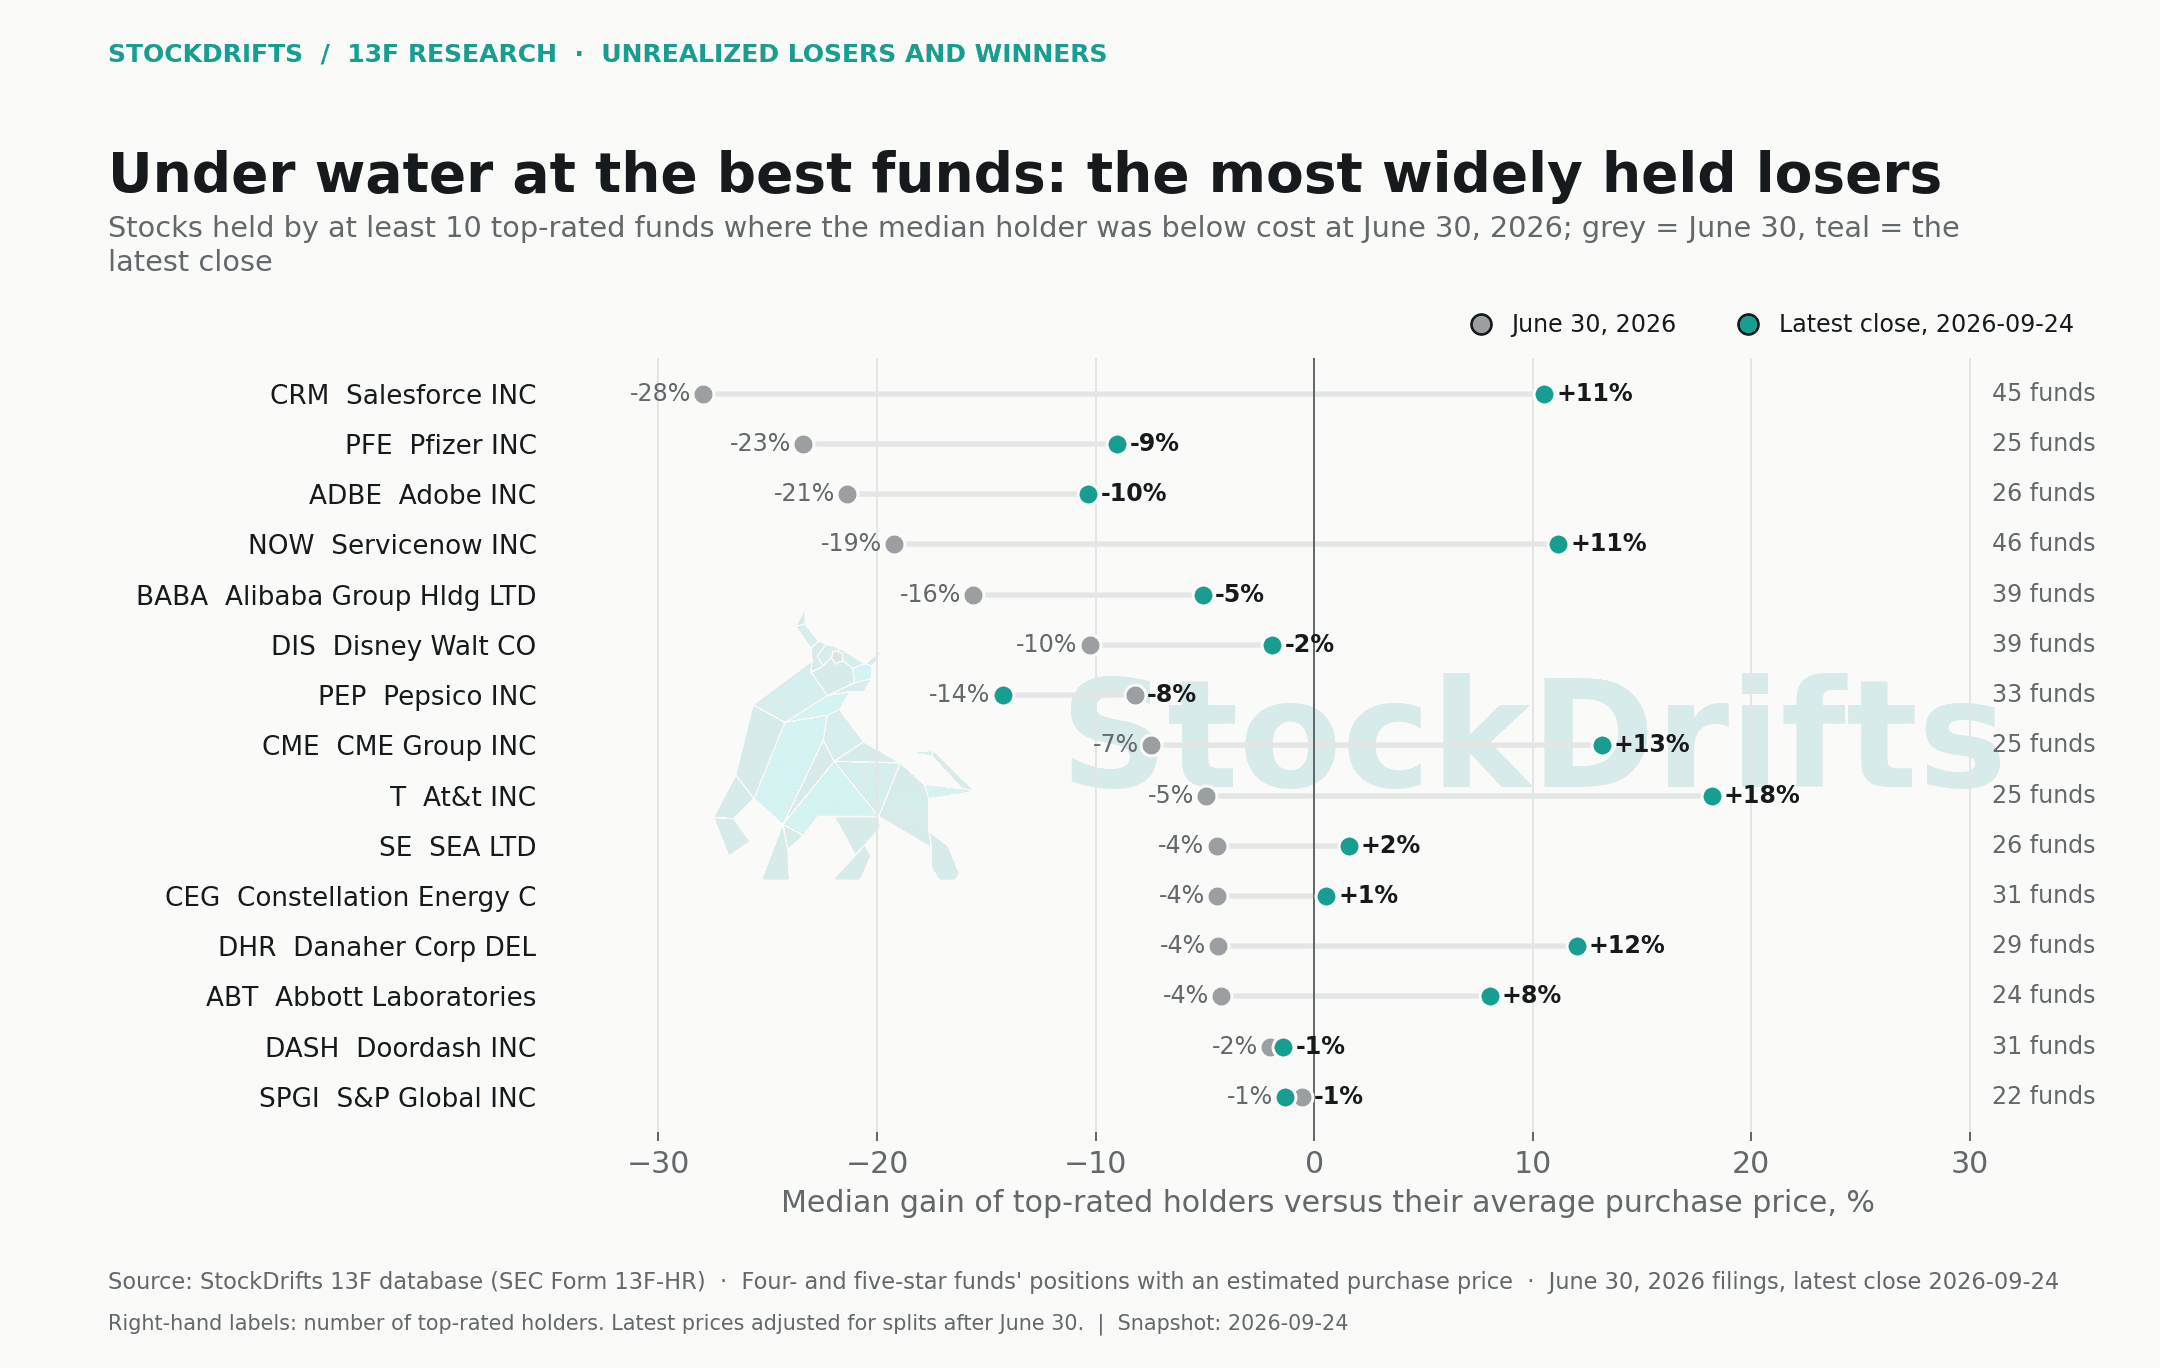
Restrict the view to stocks held by at least ten top-rated funds and take the median holder's gain versus cost. 84 of the 635 widely held stocks had a median holder below cost at June 30 (at least eight holders). The deepest, among names with ten or more holders: Intuit (−34%, 20 holders), Boston Scientific (−33%, 20 holders, $2.8bn), Salesforce (−28%, 45 holders, $2.8bn), then Pfizer, Adobe, ServiceNow (46 holders), Coupang, Alibaba (39 holders), Disney (39), T-Mobile, Medtronic, PepsiCo and CME.
The list has a shape. Application software (Intuit, Salesforce, Adobe, ServiceNow) is the largest cluster; medical devices (Boston Scientific, Medtronic) and payments (PayPal, Fiserv, Global Payments) follow; the rest are a mix of defensive consumer and Chinese e-commerce. These are the stocks the top-rated funds bought and were, at June 30, wrong about so far.
The second dot on the chart moves the comparison to the September 24, 2026 close. Salesforce (+11% now), ServiceNow (+11%), CME, AT&T, Danaher and Abbott have since crossed back above the median holder's cost. Intuit (−29%), Boston Scientific (−29%), Coupang (—) and PepsiCo have moved further below it. The count of widely held stocks under water rose from 84 at June 30 to 118 at the latest close, because the summer took more from the winners than it gave to the losers.
| Stock | Holders | Median vs cost, Jun 30 | Median vs cost, September 24, 2026 | Holders below cost | Elite dollars | Median weight |
|---|---|---|---|---|---|---|
| MSTRStrategy INC · Software - Application | 9 | −48% | −6% | 89% | $3.2bn | 0.6% |
| FIGFigma INC · Software - Application | 9 | −44% | −33% | 100% | $1.1bn | 1.1% |
| JBIOJade Biosciences INC · Biotechnology | 9 | −42% | −61% | 78% | $351m | 1.1% |
| ZZillow Group INC · Internet Content & Information | 8 | −39% | −46% | 100% | $141m | 0.5% |
| CRCLCircle Internet Group INC · Financial - Capital Markets | 12 | −38% | −8% | 100% | $846m | 2.1% |
| NKENike INC · Apparel - Footwear & Accessories | 16 | −38% | −46% | 100% | $135m | 0.7% |
| INTUIntuit · Software - Application | 20 | −34% | −29% | 90% | $365m | 0.7% |
| BSXBoston Scientific Corp · Medical - Devices | 20 | −33% | −29% | 95% | $2.8bn | 0.8% |
| VORVOR Biopharma INC · Biotechnology | 8 | −32% | −34% | 75% | $319m | 1.4% |
| TEAMAtlassian Corporation · Software - Application | 9 | −32% | +71% | 67% | $833m | 1.1% |
| ACNAccenture PLC Ireland · Information Technology Services | 10 | −30% | +2% | 100% | $148m | 0.7% |
| KRMNKarman Hldgs INC · Aerospace & Defense | 9 | −28% | −51% | 89% | $619m | 1.0% |
| CRMSalesforce INC · Software - Application | 45 | −28% | +11% | 96% | $2.8bn | 0.8% |
| LXEOLexeo Therapeutics INC · Biotechnology | 8 | −27% | −47% | 100% | $110m | 0.6% |
| FISVFiserv INC · Information Technology Services | 10 | −26% | −32% | 100% | $124m | 1.5% |
| PYPLPaypal Hldgs INC · Financial - Credit Services | 12 | −26% | −7% | 92% | $296m | 0.8% |
| PDDPDD Holdings INC · Specialty Retail | 18 | −25% | −23% | 94% | $2.7bn | 1.3% |
| PINSPinterest INC · Internet Content & Information | 8 | −25% | −34% | 88% | $98m | 0.5% |
| JDJD.COM INC · Specialty Retail | 9 | −25% | −21% | 100% | $435m | 0.9% |
| FUTUFutu Hldgs LTD · Financial - Capital Markets | 8 | −24% | −12% | 75% | $387m | 2.5% |
| ZTSZoetis INC · Drug Manufacturers - Specialty & Generic | 8 | −24% | −25% | 88% | $26m | 0.7% |
| PFEPfizer INC · Drug Manufacturers - General | 25 | −23% | −9% | 96% | $248m | 0.7% |
| WDAYWorkday INC · Software - Application | 15 | −22% | +23% | 87% | $328m | 1.1% |
| ADBEAdobe INC · Software - Application | 26 | −21% | −10% | 96% | $1.4bn | 0.8% |
| TTANServicetitan INC · Software - Application | 8 | −21% | −32% | 75% | $309m | 1.6% |
04 / The winners
Micron at 8x, and what the summer took back
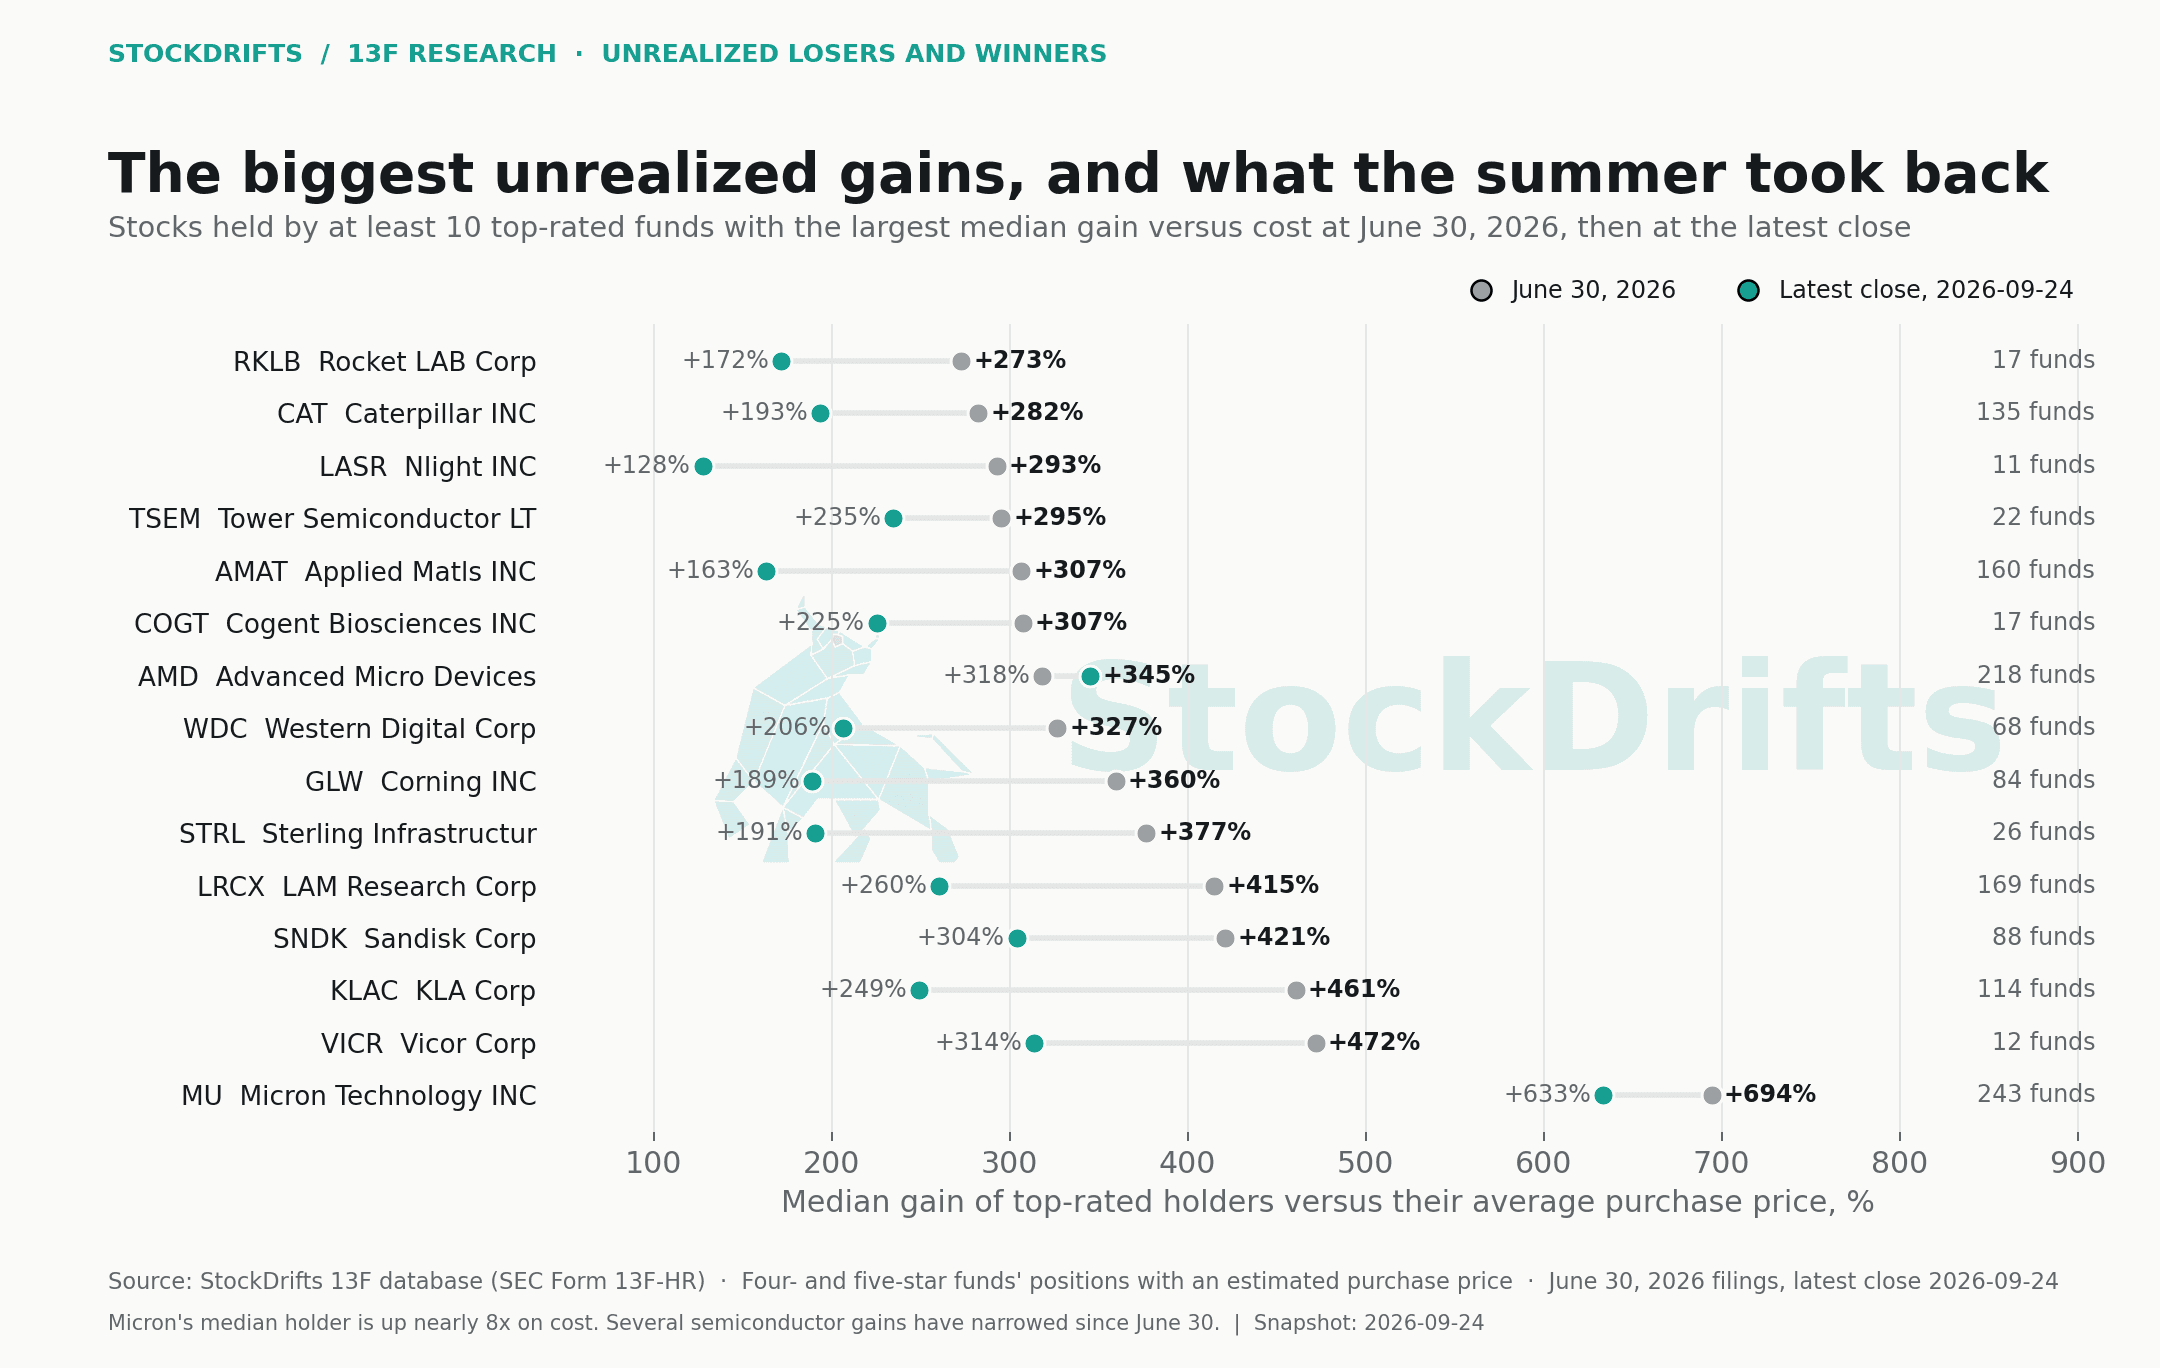
The other end of the table is the AI hardware trade held from early. Micron: 243 top-rated holders, $96.0bn of positions, median holder up 695% on cost at June 30 and 633% at the latest close. Vicor (+472%), KLA (+461%, 114 holders, $40.3bn), Sandisk, Lam Research, Sterling Infrastructure, Erasca, Corning and Western Digital follow, all with the median holder up three- to fivefold.
Between June 30 and September 24, 2026, most of those gains narrowed. KLA's median holder went from +461% to +249%, Lam Research from +415% to +260%, Applied Materials from +307% to +163%, Corning from +360% to +189%. AMD is the exception, up further. The flow study found the same funds selling these names into the June quarter's rally; the cost data says why they could afford to.
| Stock | Holders | Median vs cost, Jun 30 | Median vs cost, September 24, 2026 | Holders below cost | Elite dollars | Median weight |
|---|---|---|---|---|---|---|
| MUMicron Technology INC · Semiconductors | 243 | +695% | +633% | 0% | $96.0bn | 2.6% |
| VICRVicor Corp · Hardware, Equipment & Parts | 12 | +472% | +314% | 0% | $706m | 3.5% |
| KLACKLA Corp · Semiconductors | 114 | +461% | +249% | 0% | $40.3bn | 1.6% |
| SNDKSandisk Corp · Computer Hardware | 88 | +421% | +304% | 0% | $11.4bn | 1.8% |
| LRCXLAM Research Corp · Semiconductors | 169 | +415% | +260% | 0% | $19.3bn | 1.6% |
| STRLSterling Infrastructure INC · Engineering & Construction | 26 | +377% | +191% | 0% | $986m | 1.7% |
| ERASErasca INC · Biotechnology | 9 | +365% | +251% | 0% | $1.4bn | 4.7% |
| GLWCorning INC · Hardware, Equipment & Parts | 84 | +360% | +189% | 0% | $6.6bn | 1.6% |
| VPGVishay Precision Group INC · Hardware, Equipment & Parts | 9 | +352% | +107% | 0% | $307m | 1.9% |
| WDCWestern Digital Corp · Computer Hardware | 68 | +327% | +206% | 0% | $18.2bn | 1.4% |
| AMDAdvanced Micro Devices INC · Semiconductors | 218 | +318% | +345% | 0% | $23.8bn | 2.3% |
| COGTCogent Biosciences INC · Biotechnology | 17 | +307% | +225% | 0% | $1.3bn | 2.0% |
| AMATApplied Matls INC · Semiconductors | 160 | +307% | +163% | 0% | $20.5bn | 1.7% |
| TSEMTower Semiconductor LTD · Semiconductors | 22 | +295% | +235% | 0% | $2.2bn | 3.3% |
| LASRNlight INC · Semiconductors | 11 | +293% | +128% | 0% | $537m | 1.2% |
| CATCaterpillar INC · Agricultural - Machinery | 135 | +283% | +193% | 0% | $5.5bn | 1.0% |
| RKLBRocket LAB Corp · Aerospace & Defense | 17 | +273% | +172% | 0% | $733m | 1.1% |
| MRVLMarvell Technology INC · Semiconductors | 104 | +262% | +214% | 0% | $5.1bn | 1.2% |
| POWLPowell Inds INC · Electrical Equipment & Parts | 14 | +261% | +139% | 0% | $215m | 0.7% |
| IESCIES Holdings INC · Engineering & Construction | 9 | +258% | +210% | 0% | $7.9bn | 3.4% |
05 / By industry and sector
Where the losses cluster
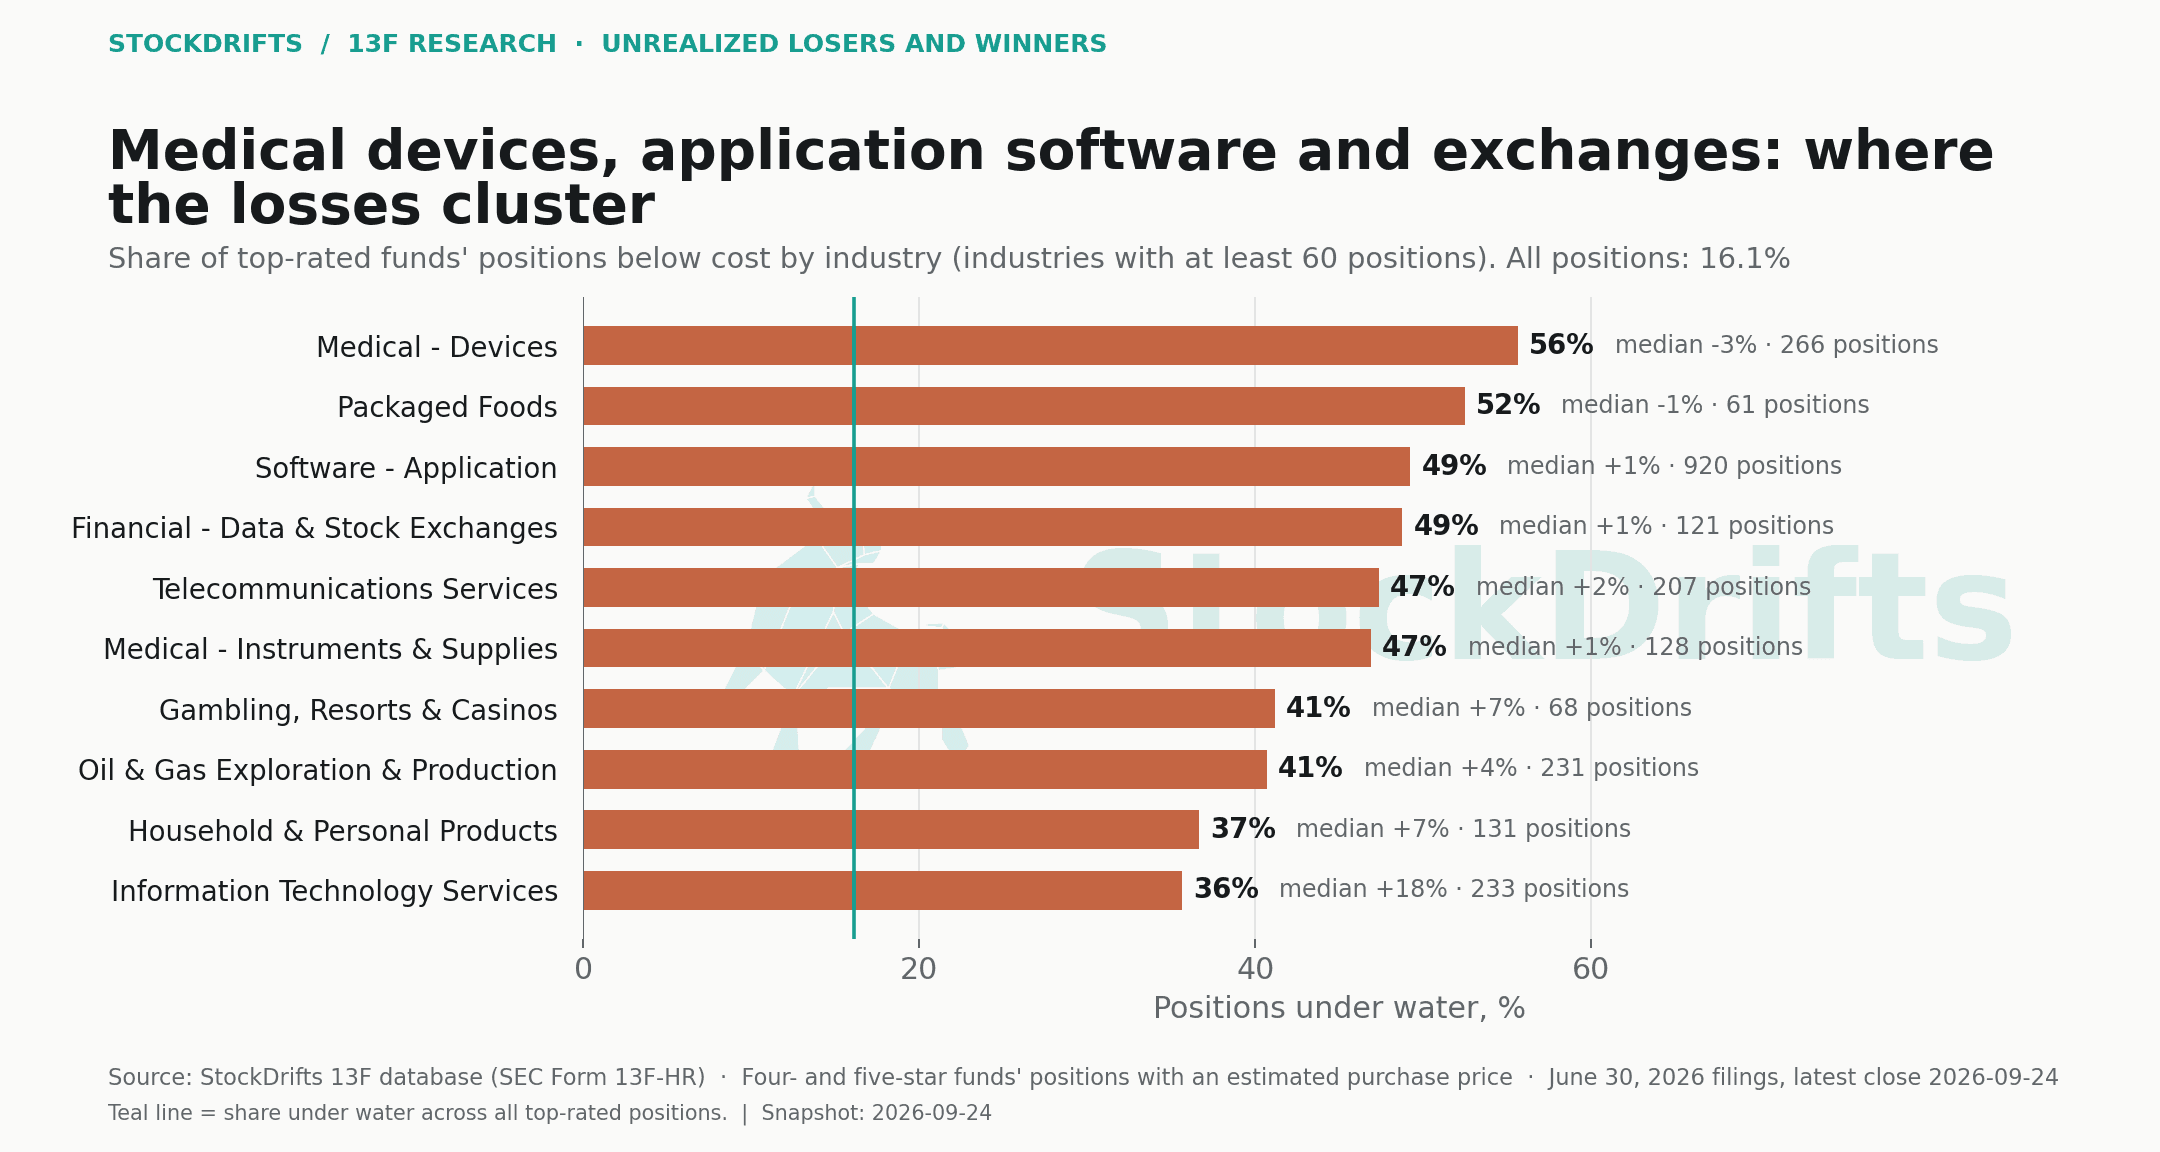
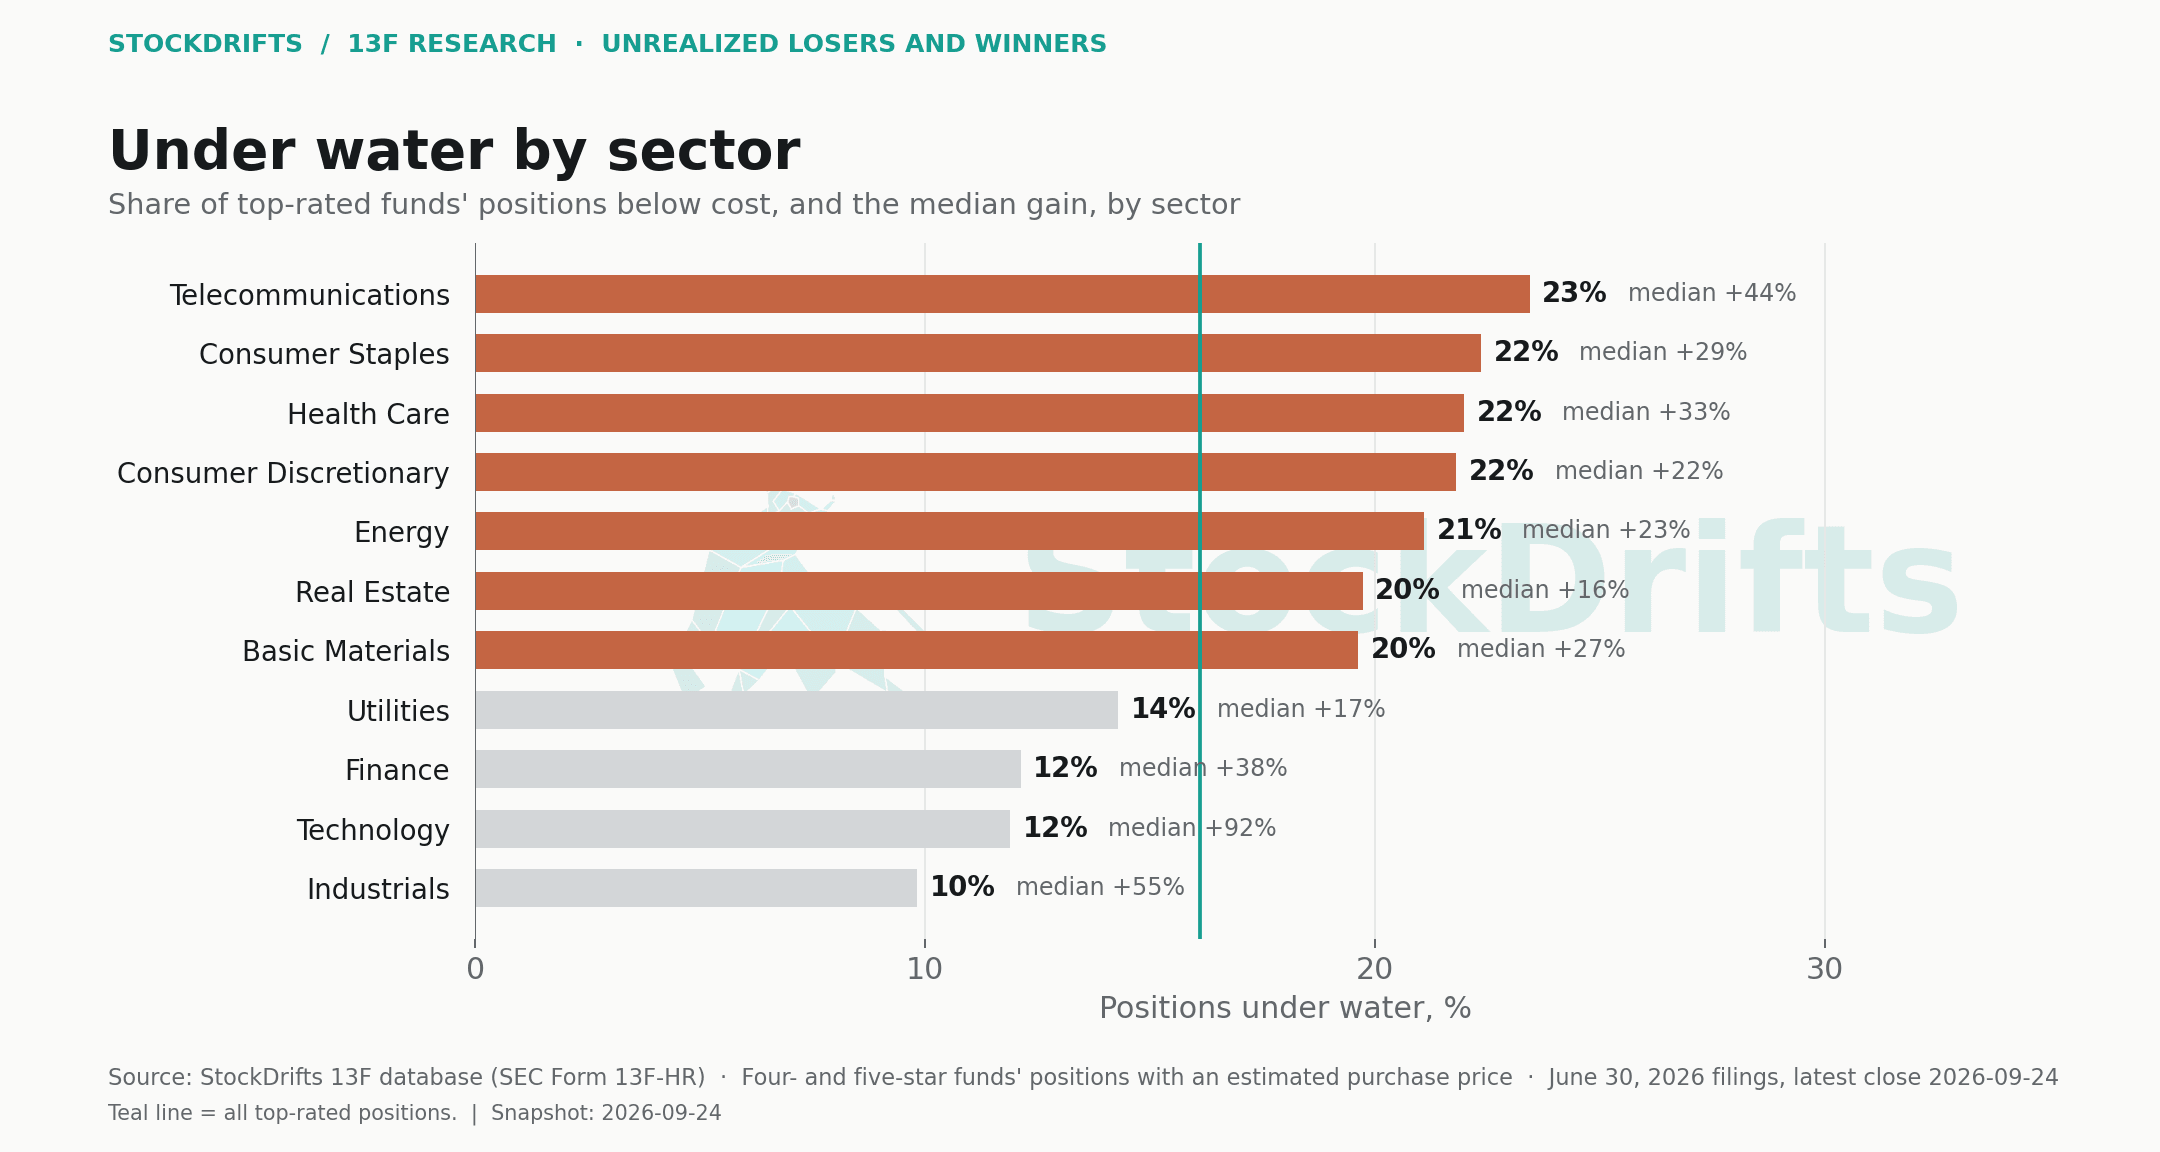
By industry, medical devices lead with 56% of top-rated positions below cost and a median gain of −3%; packaged foods 52%; application software 49% across 920 positions and $66.7bn, the largest pool of dollars on the list; exchanges and data providers 49%; telecom services and medical instruments 47%. By sector, telecommunications, consumer staples, health care and consumer discretionary all sit above the 16% average; technology (12% under water, median +92%) and industrials (10%, median +55%) sit well below it.
06 / Big bets below cost
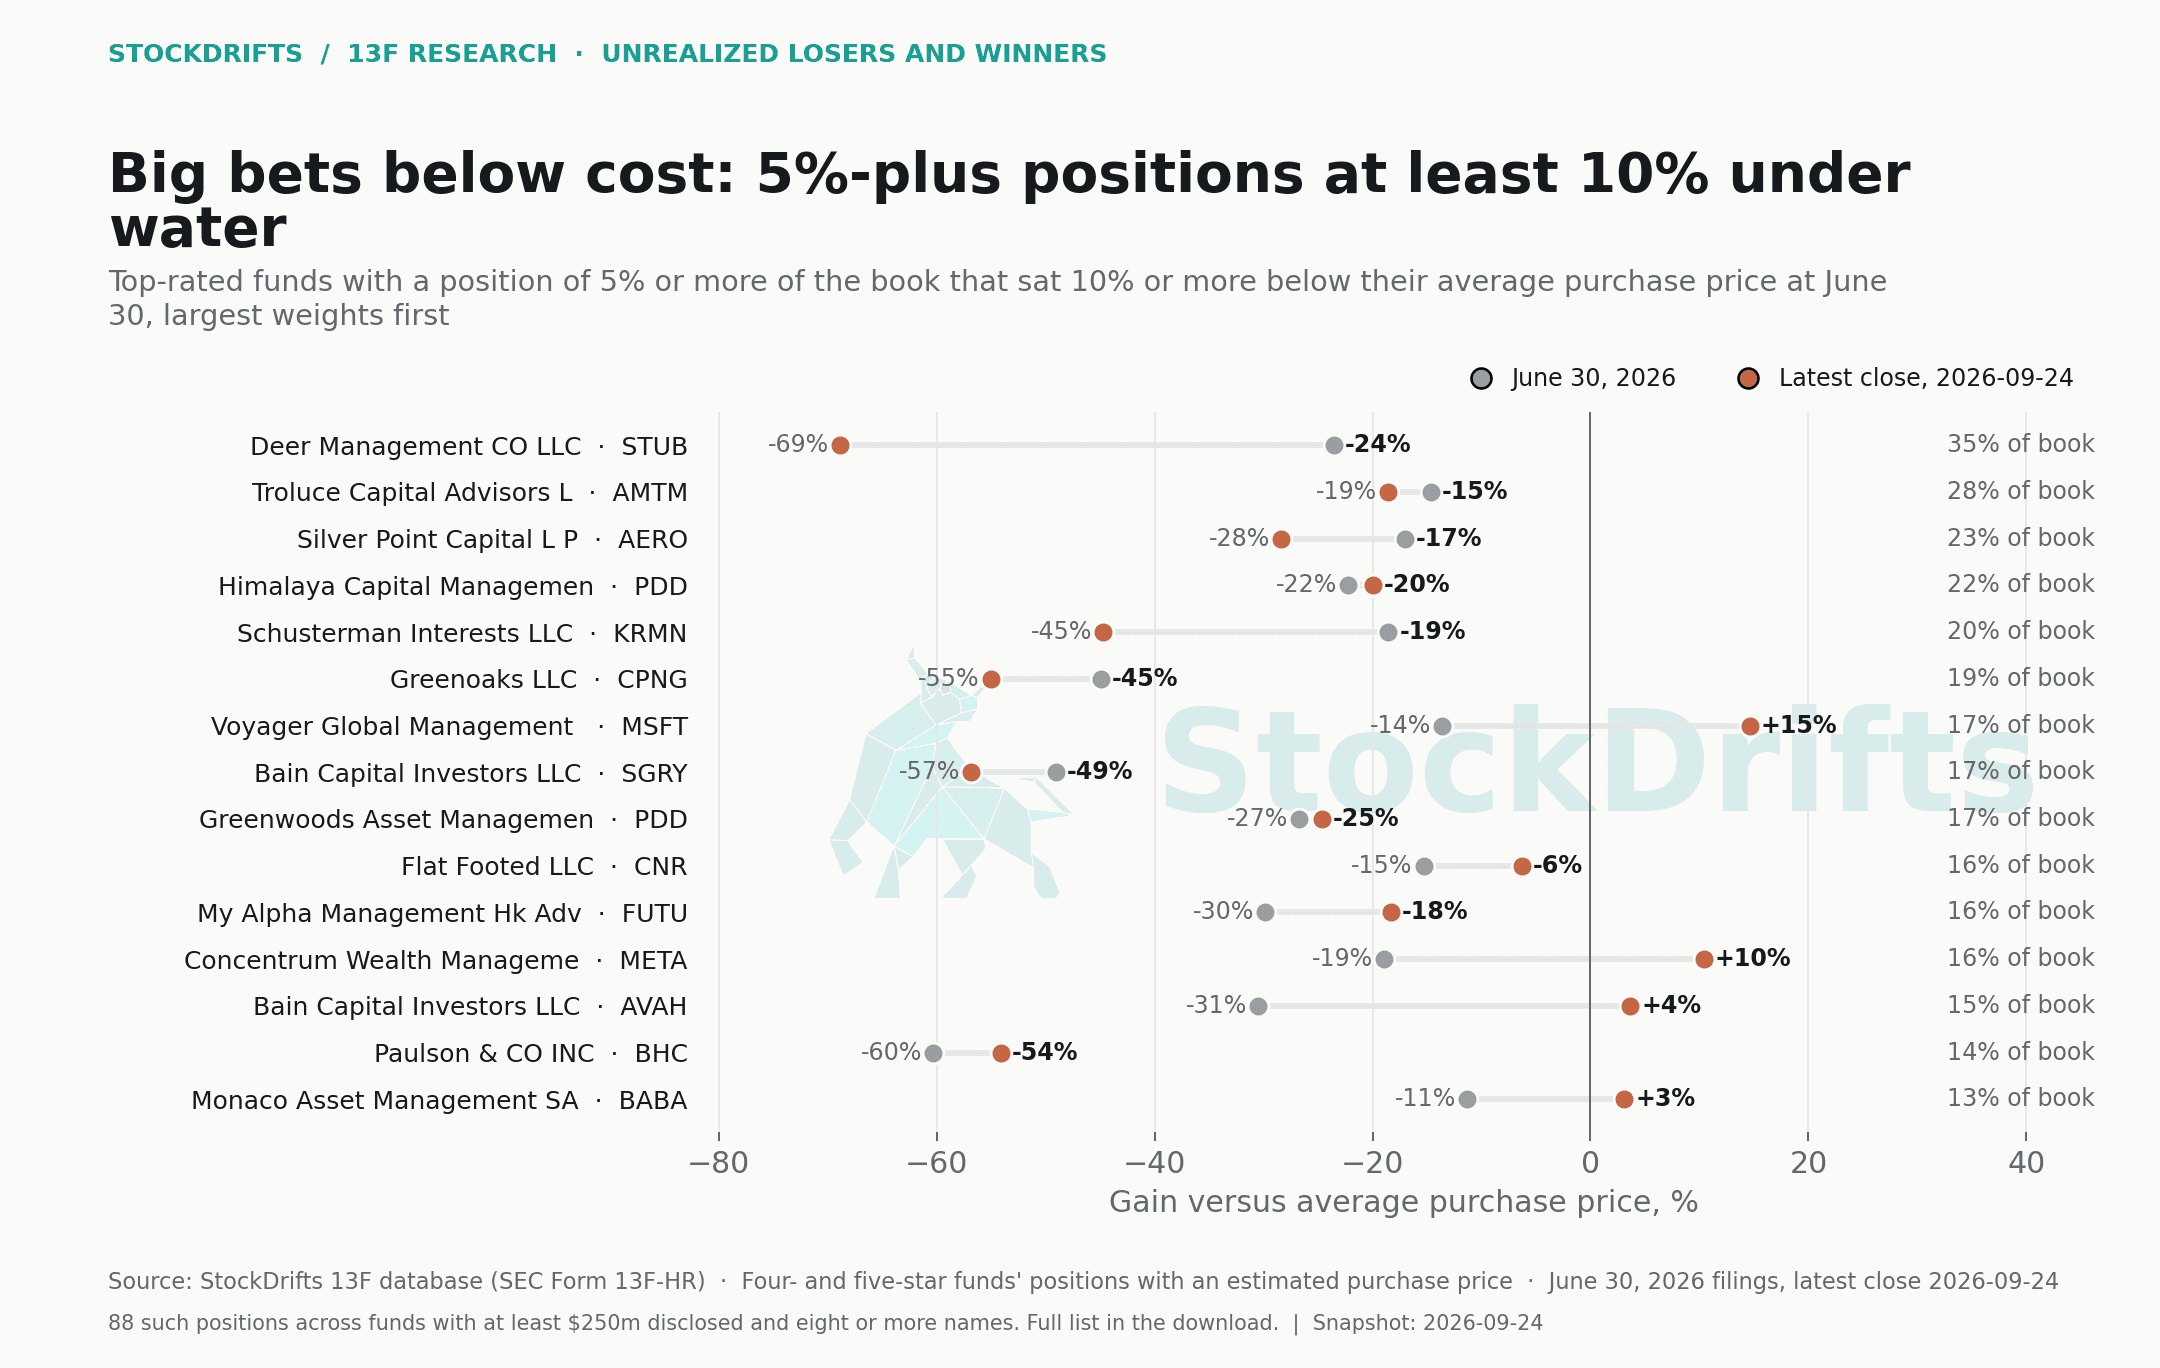
Five percent or more of the book, ten percent or more under water
The positions that matter most are the ones a fund has sized to matter. 88 positions at investable top-rated funds (at least $250m disclosed, eight or more names) were 5% or more of the book and 10% or more below cost at June 30. The largest by weight: Deer Management with 35% of its book in StubHub at −24% versus cost, now −69%; Himalaya Capital with 22% in PDD at −22%; Greenoaks with 19% in Coupang at −45%, now −55%; Voyager Global with 17% in Microsoft at −14%, since recovered to +15%; Paulson with 14% in Bausch Health at −60%; Apollo with 12% in Rackspace at −66%, now −80%.
Some of these are not stock picks in the usual sense: Apollo's Rackspace and Bain's Surgery Partners are private-equity sponsor stakes held through a listing, and StubHub is a recent IPO whose cost is its offer price. The rest are the contrarian book of the top-rated funds as of June 30: Chinese e-commerce (PDD, Alibaba, Coupang's Korean equivalent), a handful of software names bought on the way down, and Microsoft, which had one of the largest funds on the list under water at mid-year and above cost by September.
| Fund | Stock | Weight | Est. cost | Jun 30 price | vs cost, Jun 30 | vs cost, September 24, 2026 | Position |
|---|---|---|---|---|---|---|---|
| Deer Management CO LLC | STUB | 34.9% | $16.84 | $12.87 | −24% | −69% | $284m |
| Troluce Capital Advisors LLC | AMTM | 27.6% | $24.22 | $20.67 | −15% | −19% | $74m |
| Silver Point Capital L P | AERO | 22.9% | $21.70 | $18.00 | −17% | −28% | $252m |
| Himalaya Capital Management LLC | PDD | 22.2% | $98.14 | $76.28 | −22% | −20% | $821m |
| Schusterman Interests LLC | KRMN | 19.6% | $61.28 | $49.92 | −19% | −45% | $75m |
| Greenoaks LLC | CPNG | 18.9% | $31.52 | $17.37 | −45% | −55% | $446m |
| Voyager Global Management LP | MSFT | 17.5% | $431.81 | $373.02 | −14% | +15% | $634m |
| Bain Capital Investors LLC | SGRY | 17.4% | $32.95 | $16.80 | −49% | −57% | $839m |
| Greenwoods Asset Management Hong Kong Ltd. | PDD | 16.7% | $104.18 | $76.28 | −27% | −25% | $365m |
| Flat Footed LLC | CNR | 16.2% | $94.49 | $80.02 | −15% | −6% | $93m |
| My Alpha Management Hk Advisors LTD | FUTU | 15.6% | $133.68 | $93.74 | −30% | −18% | $41m |
| Concentrum Wealth Management | META | 15.6% | $694.79 | $563.29 | −19% | +10% | $65m |
| Bain Capital Investors LLC | AVAH | 14.5% | $12.34 | $8.57 | −31% | +4% | $699m |
| Paulson & CO INC | BHC | 14.0% | $12.43 | $4.93 | −60% | −54% | $361m |
| Monaco Asset Management SAM | BABA | 12.8% | $108.23 | $95.98 | −11% | +3% | $34m |
| Juniper Investment Company LLC | AORT | 12.0% | $27.46 | $22.47 | −18% | −14% | $45m |
| Apollo Management Holdings L P | RXT | 11.9% | $19.29 | $6.53 | −66% | −80% | $846m |
| Greenstone Partners & CO LLC | GWRE | 11.5% | $156.61 | $123.05 | −21% | −3% | $50m |
| Keywise Capital Management (hk) LTD | CRCL | 11.2% | $125.97 | $62.63 | −50% | −26% | $78m |
| Long Walk Management LP | APPF | 11.1% | $204.19 | $160.35 | −21% | +1% | $49m |
| Juniper Investment Company LLC | OFIX | 10.8% | $14.33 | $9.14 | −36% | −36% | $41m |
| Keenan Capital LLC | APPF | 10.6% | $195.24 | $160.35 | −18% | +5% | $54m |
| Nea Management Company LLC | SGP | 10.4% | $25.91 | $22.26 | −14% | +6% | $165m |
| Troluce Capital Advisors LLC | MIR | 10.3% | $20.16 | $17.93 | −11% | −20% | $28m |
| Greenstone Partners & CO LLC | APPF | 10.1% | $184.66 | $160.35 | −13% | +11% | $44m |
07 / Same stock, different entry
Where the crowd paid more
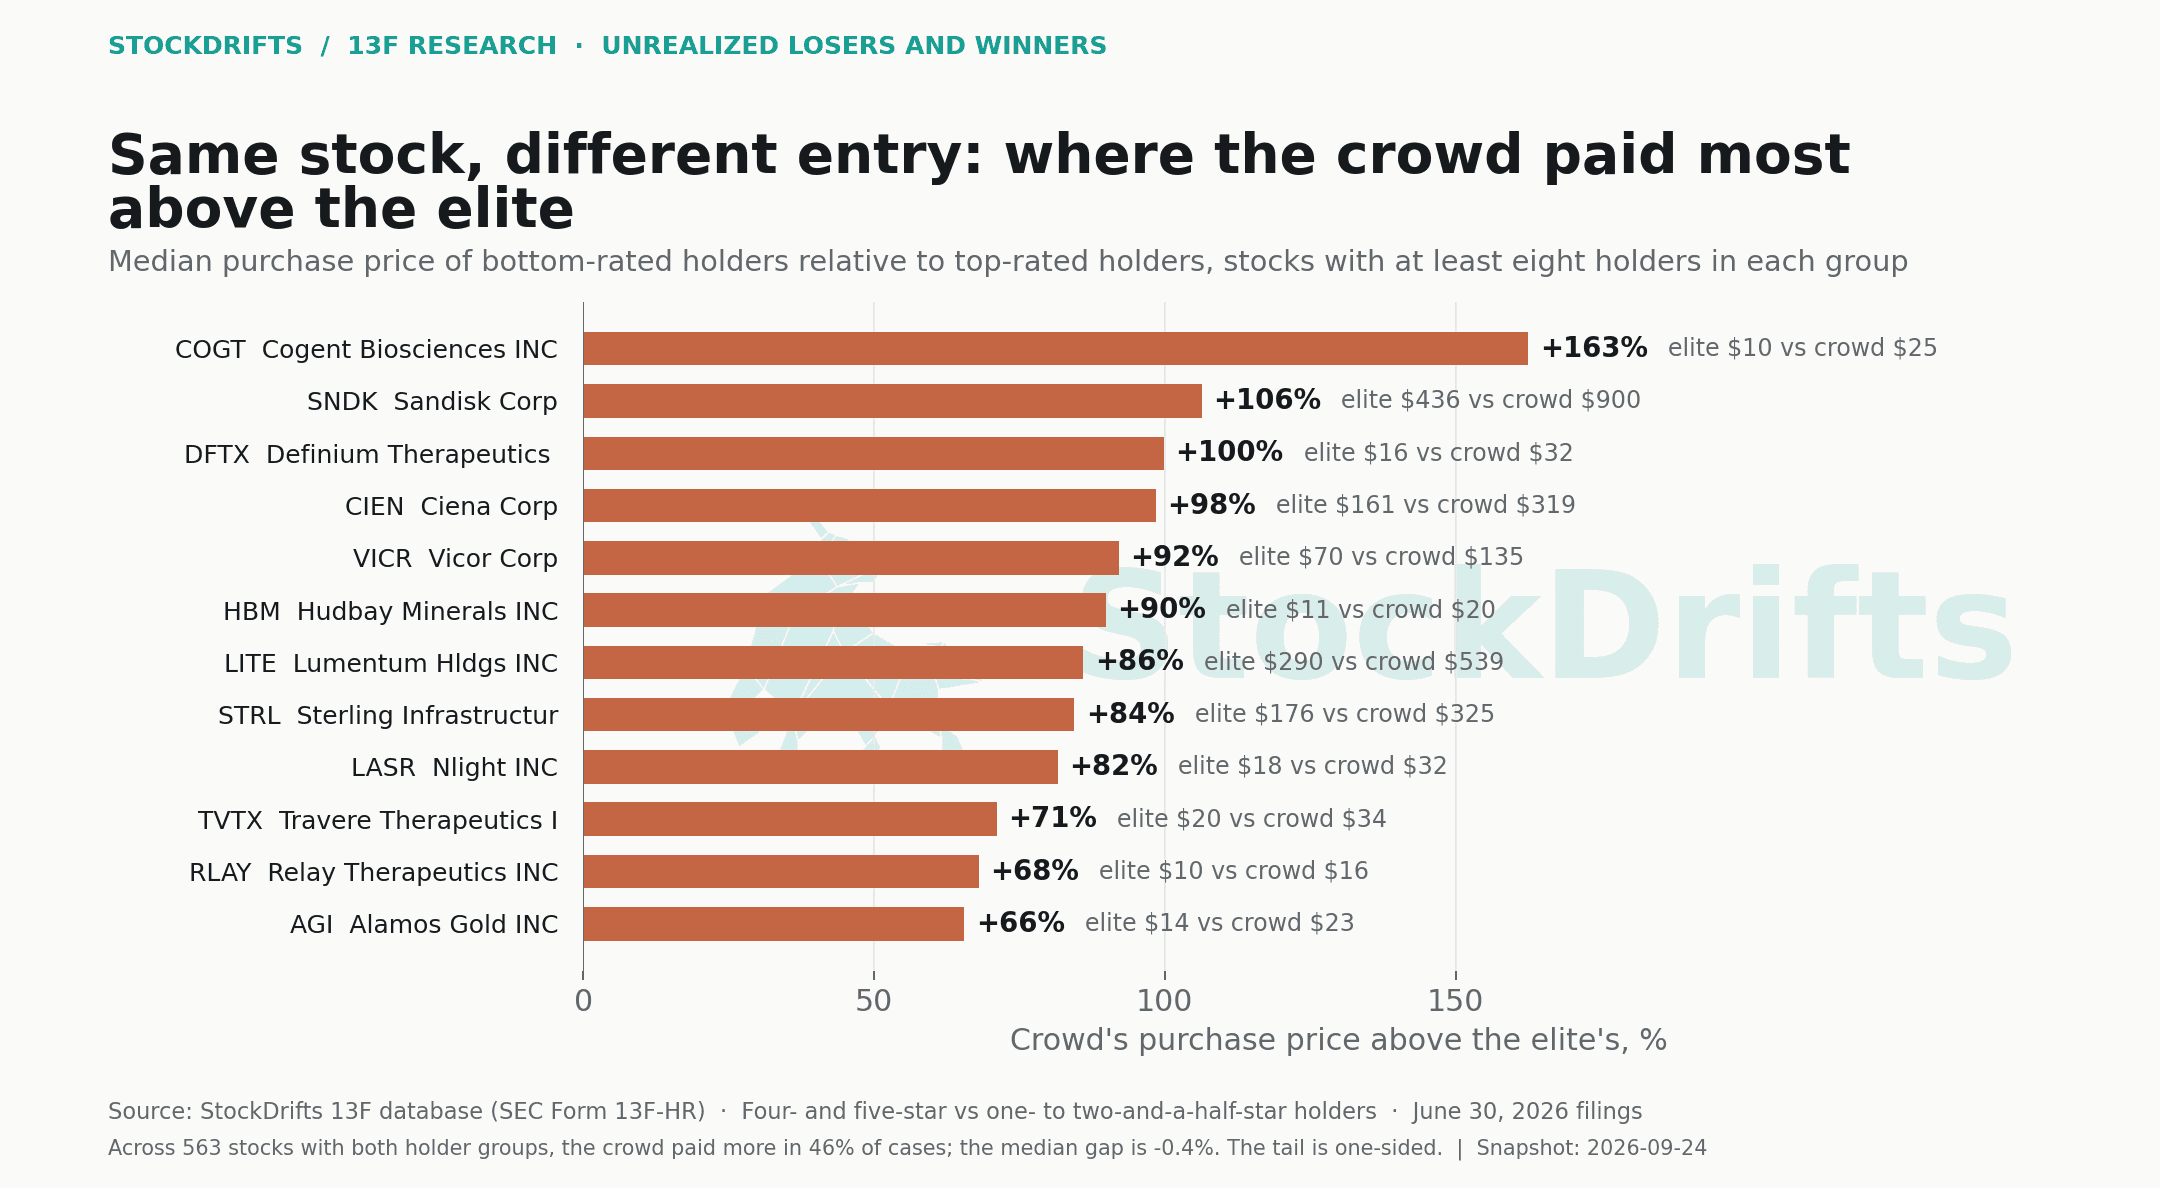
For stocks with at least eight holders in both groups, compare the median purchase price of top-rated holders with that of bottom-rated holders. Across 563 such stocks the crowd paid more in 46% of cases and the median gap is −0.4%: on the typical stock, the two groups paid about the same. The tail is one-sided. On Cogent Biosciences the crowd's median cost is 163% above the elite's ($25 against $10); on Sandisk 106% ($900 against $436); on Ciena, Vicor, Lumentum, Sterling Infrastructure and nLight between 80% and 100%. Every name on the list is a stock that ran, and in every case the bottom-rated funds' cost sits closer to the top.
This is the flow study's finding seen from the other side. In Q2 the bottom-rated funds were net buyers of the memory and optical names the top-rated funds were selling; here, their average entry into those same names sits well above the elite's. The top-rated funds' edge in these stocks was not owning them, it was owning them first.
08 / Explore the evidence
Every widely held stock
Search the 635 stocks held by at least eight top-rated funds. Gains are the median holder's gain versus estimated cost at June 30 and at the September 24, 2026 close; the split-adjusted latest price is used where a split occurred after June 30.
Loading the table… · stocks with 8+ top-rated holders and an estimated cost
| Stock | Top-rated holders | Median vs cost, Jun 30 | Median vs cost, latest | Holders below cost | Elite dollars | Median weight | Price since Jun 30 |
|---|
Nothing matches these filters.
09 / Methodology & limitations
Exactly what went into this study
The purchase price. For each position the database carries an estimated average purchase price, reconstructed from the sequence of disclosed share changes: shares added in a quarter are assumed bought at that quarter's price, shares held before the history begins at their price then. It is an estimate. It will be too low for positions built over many years (the estimate then reflects prices from when the history starts) and it cannot see trades made and reversed inside a quarter. Positions without an estimate (0 of the top-rated rows) are excluded. Gains are the June 30, 2026 price implied by the filing (value divided by shares, median across holders) divided by the estimate, minus one.
The latest close. Yahoo Finance adjusted close on September 24, 2026. Five stocks split after June 30 (Amphenol 2:1, CrowdStrike 4:1, IES 2:1, Monster 2:1, StoneX 3:2); their latest prices are scaled back to filing units before comparison. The largest remaining gap between Yahoo's June 30 close and the filing-implied price is under 1%.
Who is in. Top-rated is four stars or better with 12 or more quarters, from the same active-picker universe as the other articles in this series (763 funds, 24,746 positions with a cost estimate). Bottom-rated is two and a half stars or below with the same filters (82,836 positions). Named fund lists require $250m disclosed and eight or more positions and exclude venture, charitable, endowment and pension filers.
Stock tables require at least eight top-rated holders (ten for the charts) so that a median is meaningful. "Holders below cost" is the share of those holders whose own estimate sits above the price. The industry table requires 60 positions; the elite-versus-crowd cost comparison requires eight holders in each group.
What a gain versus cost is not. It is not the fund's realized or reported return on the position: it ignores partial sales, dividends, hedges and the fund's own accounting. It is a way of asking whether the price today is above or below what the fund is estimated to have paid, which is the question a reader of a 13F usually wants answered.
Sources. StockDrifts 13F database (SEC Form 13F-HR, all filers), snapshot September 24, 2026, filings through September 11, 2026; prices from Yahoo Finance; industry labels from Financial Modeling Prep. Scripts, intermediate tables and the summary file are published alongside this article.
10 / Questions
Questions this study answers
- Do hedge funds lose money on their stock picks?
- On about one position in six. At June 30, 2026, 16.1% of the 24,746 top-50 positions held by four- and five-star 13F funds sat below the estimated purchase price, and 5.6% were down 20% or more. Bottom-rated funds were almost the same at 17.1%. The median position at a top-rated fund was up 44% on cost.
- What stocks are hedge funds losing money on in 2026?
- Among stocks held by at least ten top-rated funds, the deepest below the median holder's cost at June 30, 2026 were CRCL (−38%), NKE (−38%), INTU (−34%), BSX (−33%), ACN (−30%), CRM (−28%), FISV (−26%), PYPL (−26%). Application software, medical devices and payments are the clusters. Salesforce and ServiceNow have since recovered above cost; Intuit and Boston Scientific have not. Section 3 has the full table with both dates.
- Which stocks have made hedge funds the most money?
- Measured against estimated purchase price, the largest median gains among stocks held by ten or more top-rated funds were MU (+695%), VICR (+472%), KLAC (+461%), SNDK (+421%), LRCX (+415%), STRL (+377%). Micron alone: 243 top-rated holders, $96.0bn of positions, the median holder up 695% on cost. Several of those gains narrowed between June 30 and September 24, 2026.
- How do you work out a hedge fund's average purchase price from 13F filings?
- Form 13F reports positions, not trades or prices. StockDrifts reconstructs an estimated average purchase price from the sequence of disclosed share changes: shares added in a quarter are assumed bought at that quarter's price, shares already held when the history begins at their price then. It is an estimate: it cannot see trades made and reversed inside a quarter, and it understates the true cost of positions built over many years. The methodology page has the details.
- Are a hedge fund's biggest positions its best ones?
- Usually. Top-rated funds' positions over 10% of the book were below cost 9.8% of the time with a median gain of +110%; positions under 1% of the book were below cost 20.5% of the time with a median gain of +31%. Part of that is arithmetic, since winners grow into large weights; part is that funds size their conviction.
- Do ordinary funds pay more than the smart money for the same stock?
- On the typical stock, no: across 563 stocks with at least eight holders in each group, bottom-rated funds paid more in 46% of cases and the median gap is −0.4%. On the stocks that ran, yes: the crowd's median cost is 163% above the elite's on COGT, 106% on SNDK, and 80% to 100% on Ciena, Vicor, Lumentum and Sterling Infrastructure.
This study describes disclosed positions and their past returns. It is not a recommendation to buy or sell any security, and past returns of a disclosed book are not a forecast of a fund's future returns.
More in this series
- Only 21% of active 13F funds beat the S&P 500 over five yearsOriginal Research · September 24, 2026
- Does a top 13F track record persist? About a third of it doesOriginal Research · September 24, 2026
- Q2 2026: where the top-rated 13F funds are overweight, and where they are notOriginal Research · September 24, 2026
- What the best 13F funds owned before the AI crash, and whether they saw it comingOriginal Research · September 24, 2026
- How StockDrifts rates 13F funds: the star rating, the universe and the limits of the dataMethodology · September 24, 2026