 StockDrifts
What the best 13F funds owned before the AI crash, and whether they saw it coming
763 top-rated funds' June 30, 2026 books, frozen and valued through the July 29 semiconductor low. 26% of the book sat in semiconductors and hardware, up from 19% at March 31 on price alone. Held unchanged, the median book fell 5.8% while SOXX fell 27%; 24% of books fell less than the S&P 500. Q2 trading helped at 57% of funds, by a median of +0.2 pts.
Median elite book, June 30 to July 29
−5.8%
SPY −2.3% · QQQ −10.1% · SOXX −27.4%
Elite books that fell less than the S&P 500
24%
72% fell less than QQQ · 97% less than SOXX
Book in the AI / semis basket at June 30
26.3%
$710.2bn of $2.70tn · 19.5% at March 31
Funds whose Q2 trades helped
57%
Median effect +0.2 pts · net basket selling $39.5bn
The reading in 30 seconds
- The crash was narrow. SOXX peaked on June 30 itself and fell 27.4% to July 29, 2026; QQQ fell 10.1% and SPY 2.3% over the same days. The elite's combined book fell 7.0%: its basket of semiconductor, hardware and communication-equipment names fell 22.1%, everything else 1.6%.
- The exposure was a price effect, not a purchase. The basket was 19.5% of the March 31 book at March 31 prices and 26.6% of the same book at June 30 prices; Q2 trading took it to 26.4%. The elite sold a net $39.5bn of the basket in the quarter, 5.6% of the position, with 380 net sellers against 197 net buyers.
- Q2 trades helped at 57% of funds, by a median of +0.2 pts; in aggregate the June 30 book fell 6.7% against 6.8% for the March 31 book. The books that held up best (Gqg Partners LLC, Ruffer LLP, Donald Smith & CO INC) had almost nothing in the basket; the hardest hit (Oaktop Capital Management II L P, WT Asset Management Ltd, Trivest Advisors Ltd) were semiconductor specialists down 26% to 38%.
01 / The window
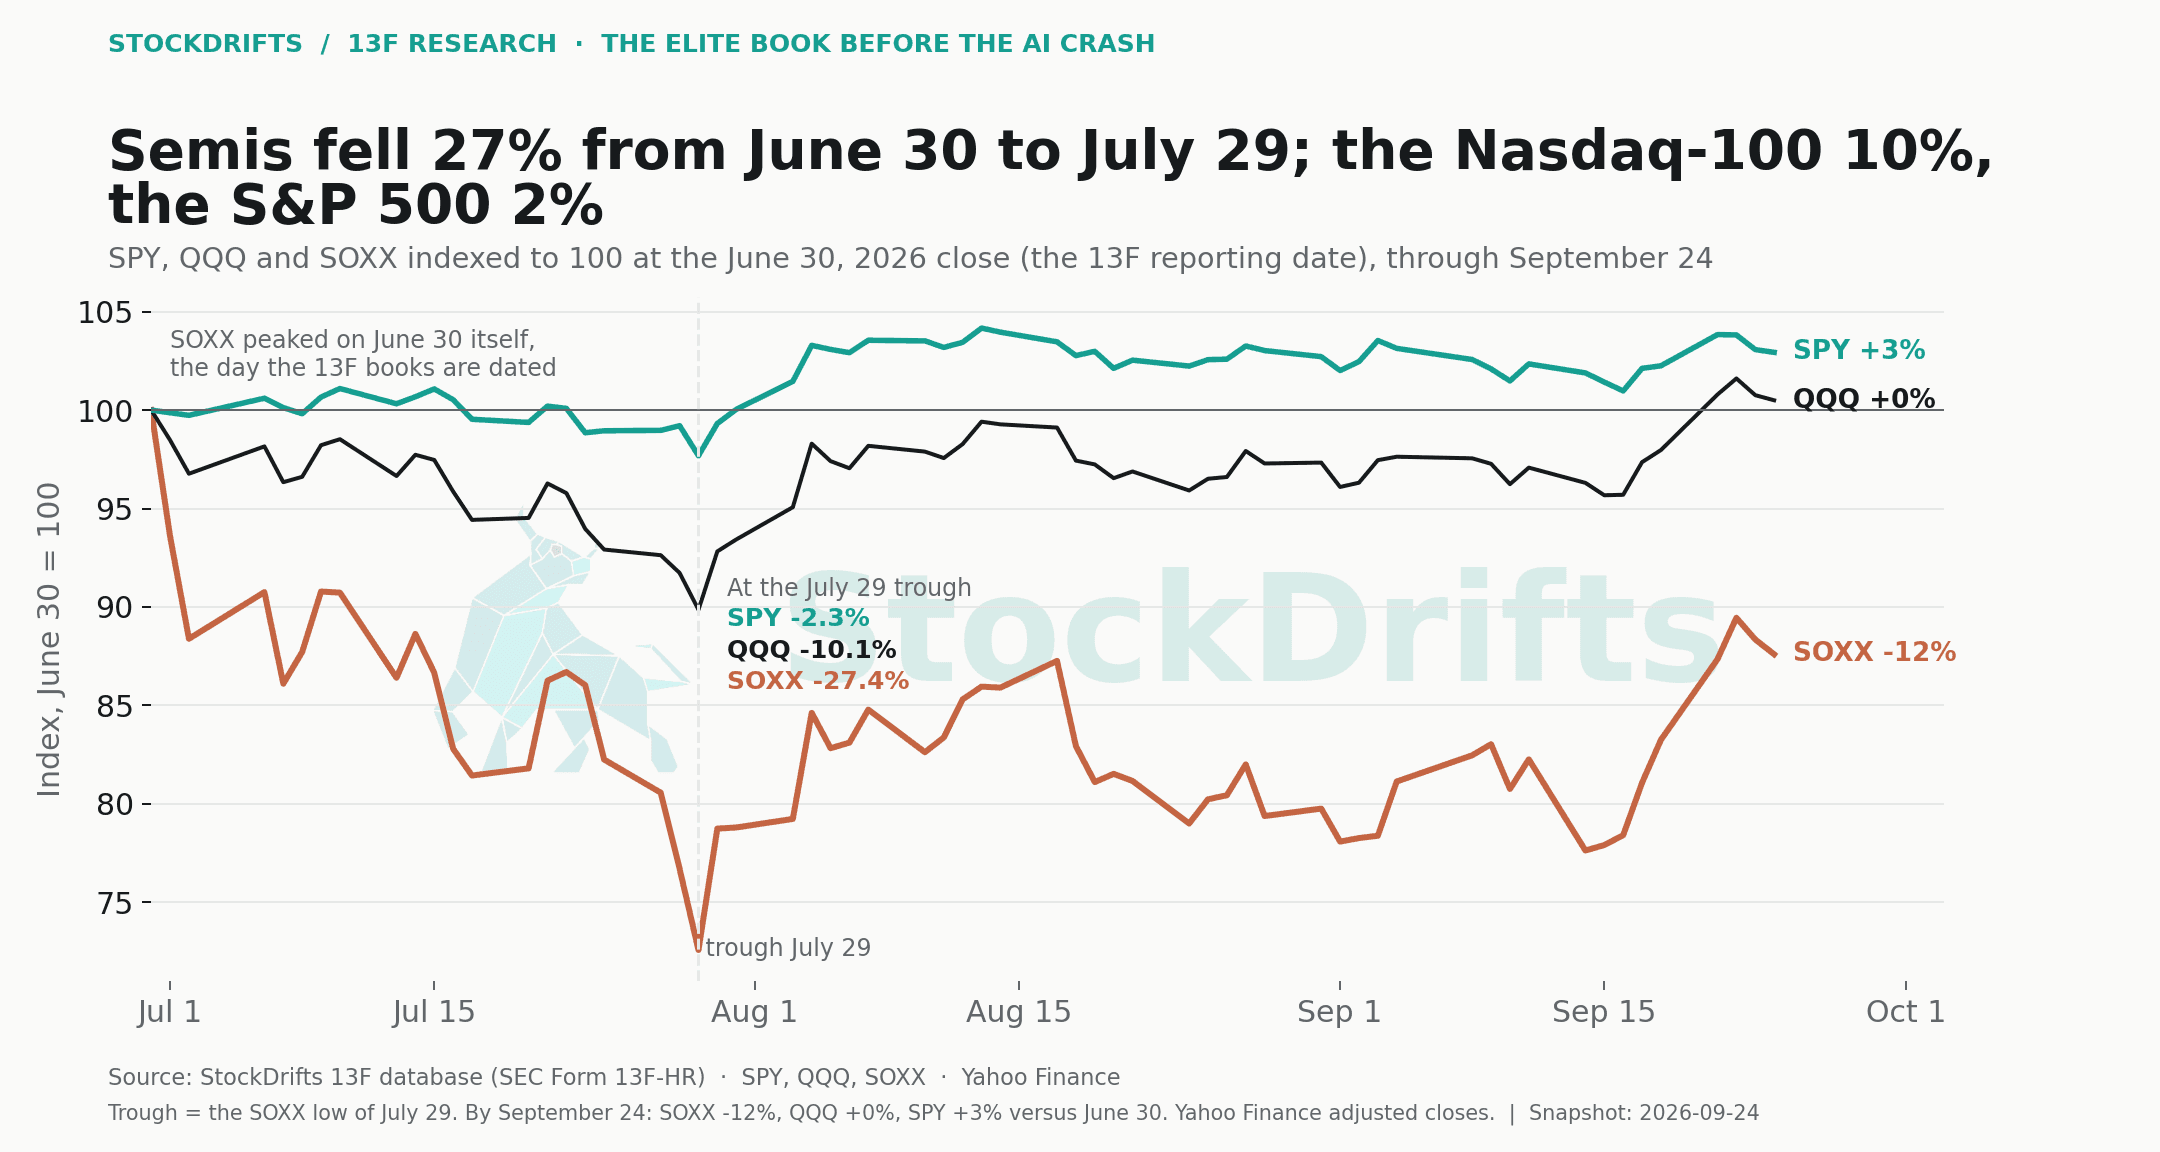
The crash: 27% in semis, 10% in the Nasdaq-100, 2% in the S&P 500
Form 13F books are dated June 30. That turned out to be the top: SOXX, the iShares semiconductor ETF, made its post-quarter high on June 30 itself and fell 27.4% to a low on July 29, 2026. QQQ fell 10.1% over the same days and SPY 2.3%. This study uses two windows, June 30 to July 29 and June 30 to September 24, 2026, and measures every fund's book over both. By September 24, 2026 SOXX was −12.4% versus June 30, QQQ +0.5% and SPY +2.9%.
It was a semiconductor drawdown, not a market one. Among the industries where the top-rated funds had $5bn or more, the largest falls to the trough were electrical equipment & parts (−34%), hardware, equipment & parts (−29%), auto - manufacturers (−28%), computer hardware (−27%) and semiconductors (−22%, $635.5bn of elite positions). Internet, software, drugs and banks were flat to slightly down.
02 / The book at June 30
What the elite owned: 26% in the names about to fall
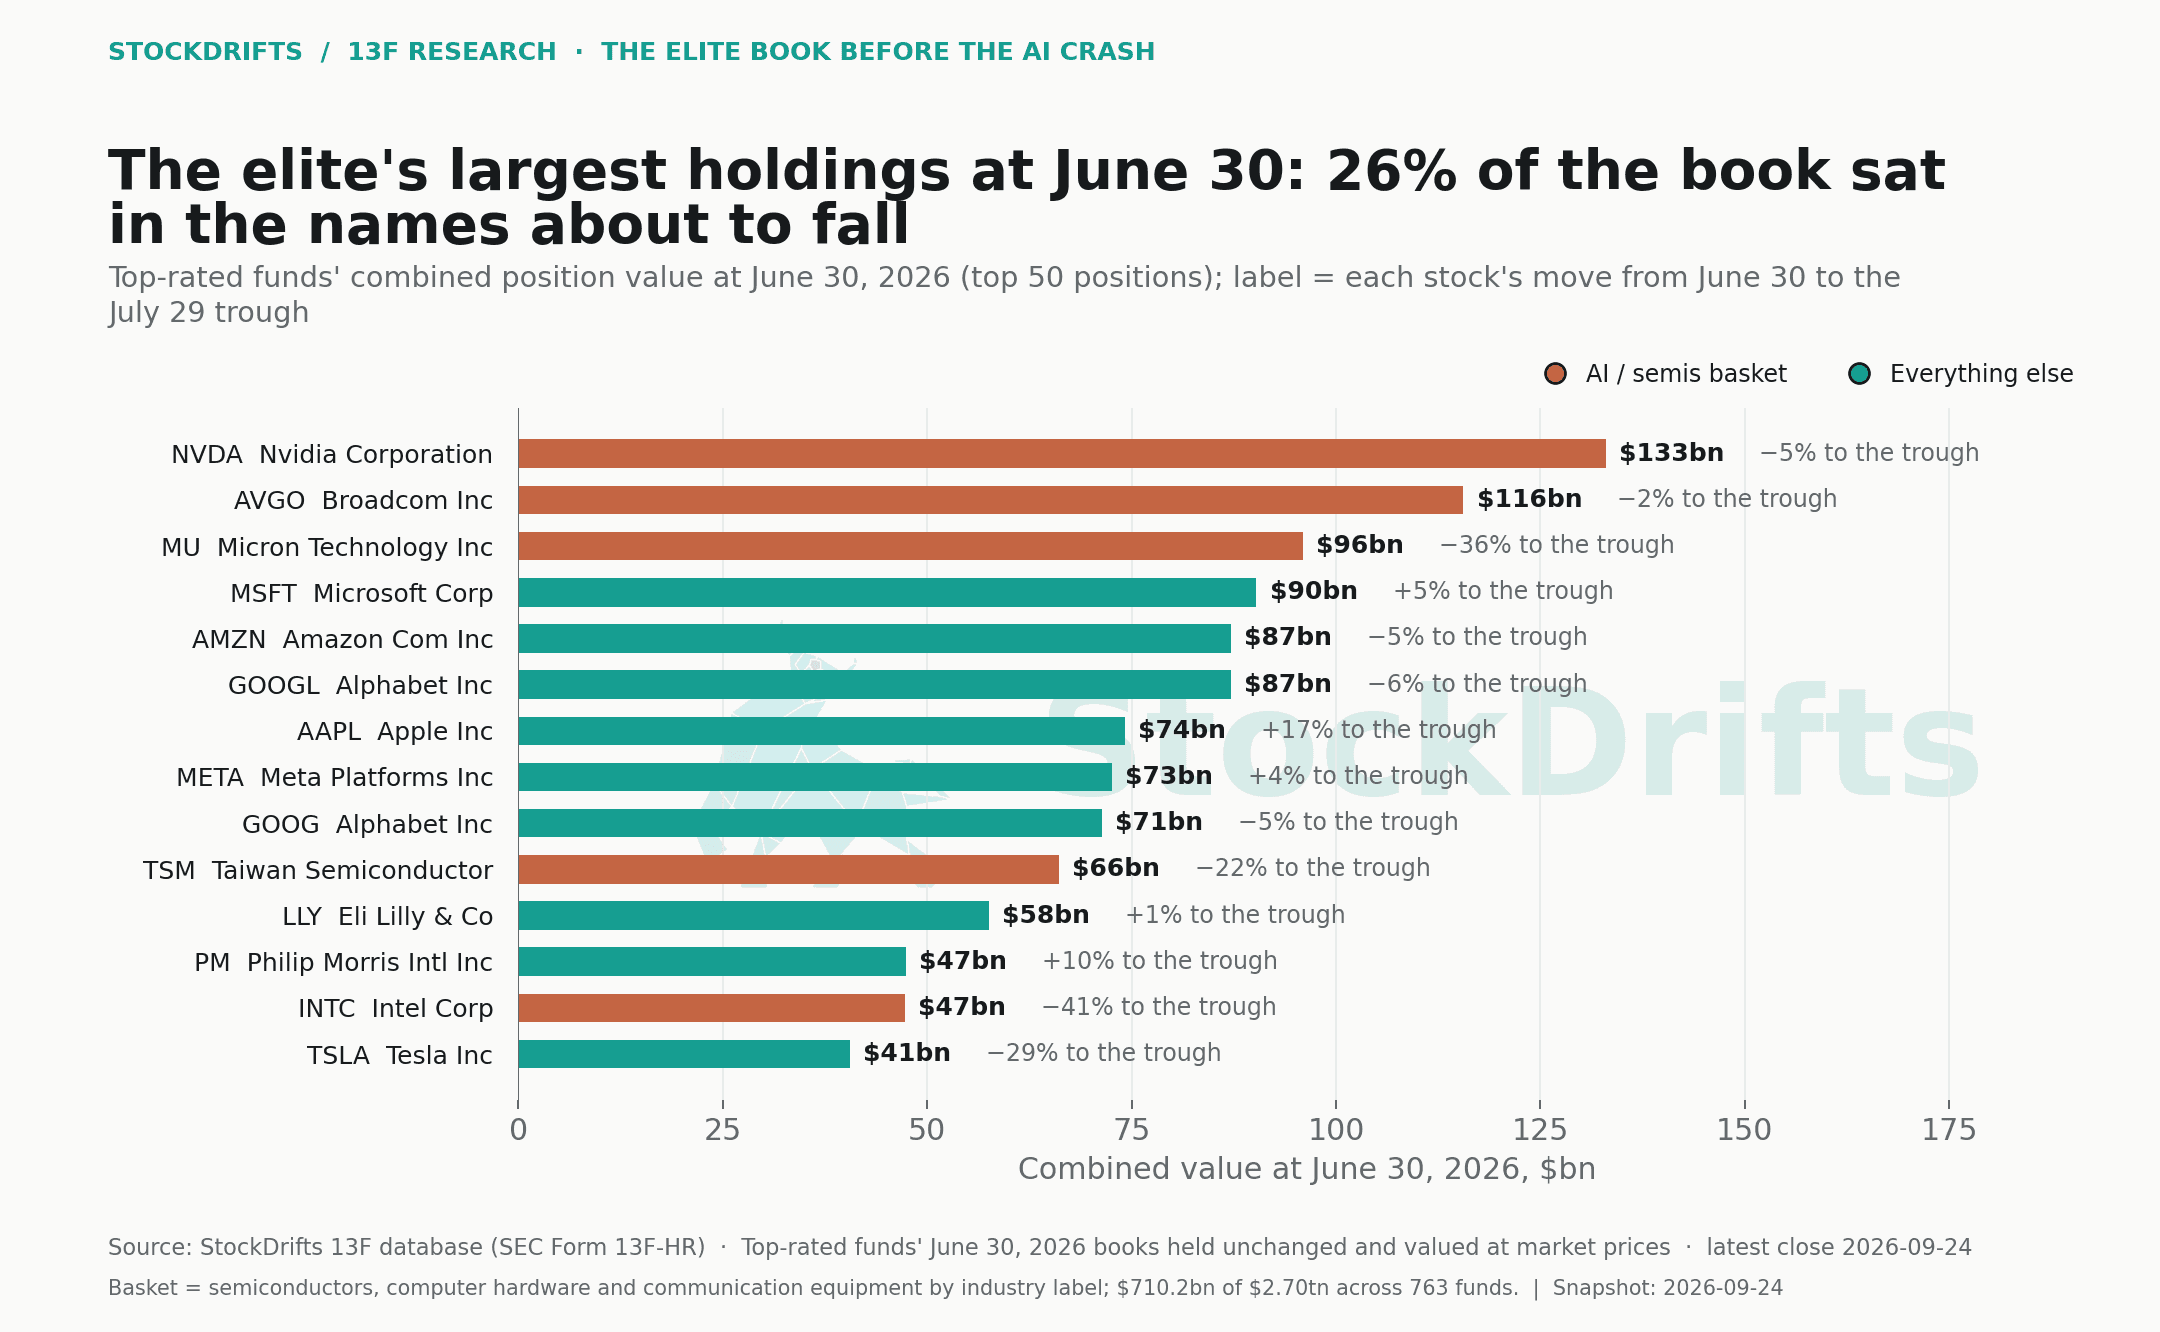
Add up the top-50 positions of the 763 top-rated funds and the book is $2.70tn. The largest names are the ones every 13F reader expects: Nvidia ($133.0bn, 383 holders, 4.9% of elite dollars), Broadcom ($115.6bn), Micron ($96.0bn, 243 holders), then Microsoft, Amazon, Alphabet, Apple, Meta and TSMC ($66.1bn). Define an AI / semis basket by industry label, with no hand-picking: semiconductors, computer hardware and communication equipment. That basket was $710.2bn, 26.3% of the elite book, held in 3,840 positions at 591 of the 763 funds. Semiconductors alone were 23.5%, more than twice the next industry (internet content & information, 9.1%).
To the trough, the basket fell 22.1% and the rest of the book 1.6%; the whole elite book, held unchanged, fell 7.0%, or $187.9bn, of which $156.6bn was the basket. Inside the basket the damage was uneven. Nvidia fell 5% and Broadcom 2%; Micron fell 36%, Intel 41%, KLA 44%, TSMC 22%. The two largest positions were the two that held up. By September 24, 2026 Nvidia was +12% versus June 30 and Micron −8%; KLA (−39%) and Intel (−11%) had not recovered.
| Stock | Holders | Elite dollars | Share of book | To July 29 | To September 24 |
|---|---|---|---|---|---|
| NVDANvidia Corporation · Semiconductors | 383 | $133.0bn | 4.9% | −5% | +12% |
| AVGOBroadcom INC · Semiconductors | 271 | $115.6bn | 4.3% | −2% | −7% |
| MUMicron Technology INC · Semiconductors | 243 | $96.0bn | 3.5% | −36% | −8% |
| MSFTMicrosoft Corp · Software - Infrastructure | 360 | $90.3bn | 3.3% | +5% | +33% |
| AMZNAmazon COM INC · Specialty Retail | 389 | $87.2bn | 3.2% | −5% | +4% |
| GOOGLAlphabet INC · Internet Content & Information | 324 | $87.2bn | 3.2% | −6% | −4% |
| AAPLApple INC · Consumer Electronics | 321 | $74.2bn | 2.8% | +17% | +17% |
| METAMeta Platforms INC · Internet Content & Information | 281 | $72.6bn | 2.7% | +4% | +37% |
| GOOGAlphabet INC · Internet Content & Information | 257 | $71.3bn | 2.6% | −5% | −4% |
| TSMTaiwan Semiconductor Manufac · Semiconductors | 207 | $66.1bn | 2.5% | −22% | −6% |
| LLYELI Lilly & CO · Drug Manufacturers - General | 206 | $57.6bn | 2.1% | +1% | −1% |
| PMPhilip Morris Intl INC · Tobacco | 40 | $47.4bn | 1.8% | +10% | +6% |
| INTCIntel Corp · Semiconductors | 134 | $47.2bn | 1.8% | −41% | −11% |
| TSLATesla INC · Auto - Manufacturers | 153 | $40.6bn | 1.5% | −29% | −10% |
| KLACKLA Corp · Semiconductors | 114 | $40.3bn | 1.5% | −44% | −39% |
03 / Into the crash
What changed in Q2: the weight rose on price, and the trades barely touched it
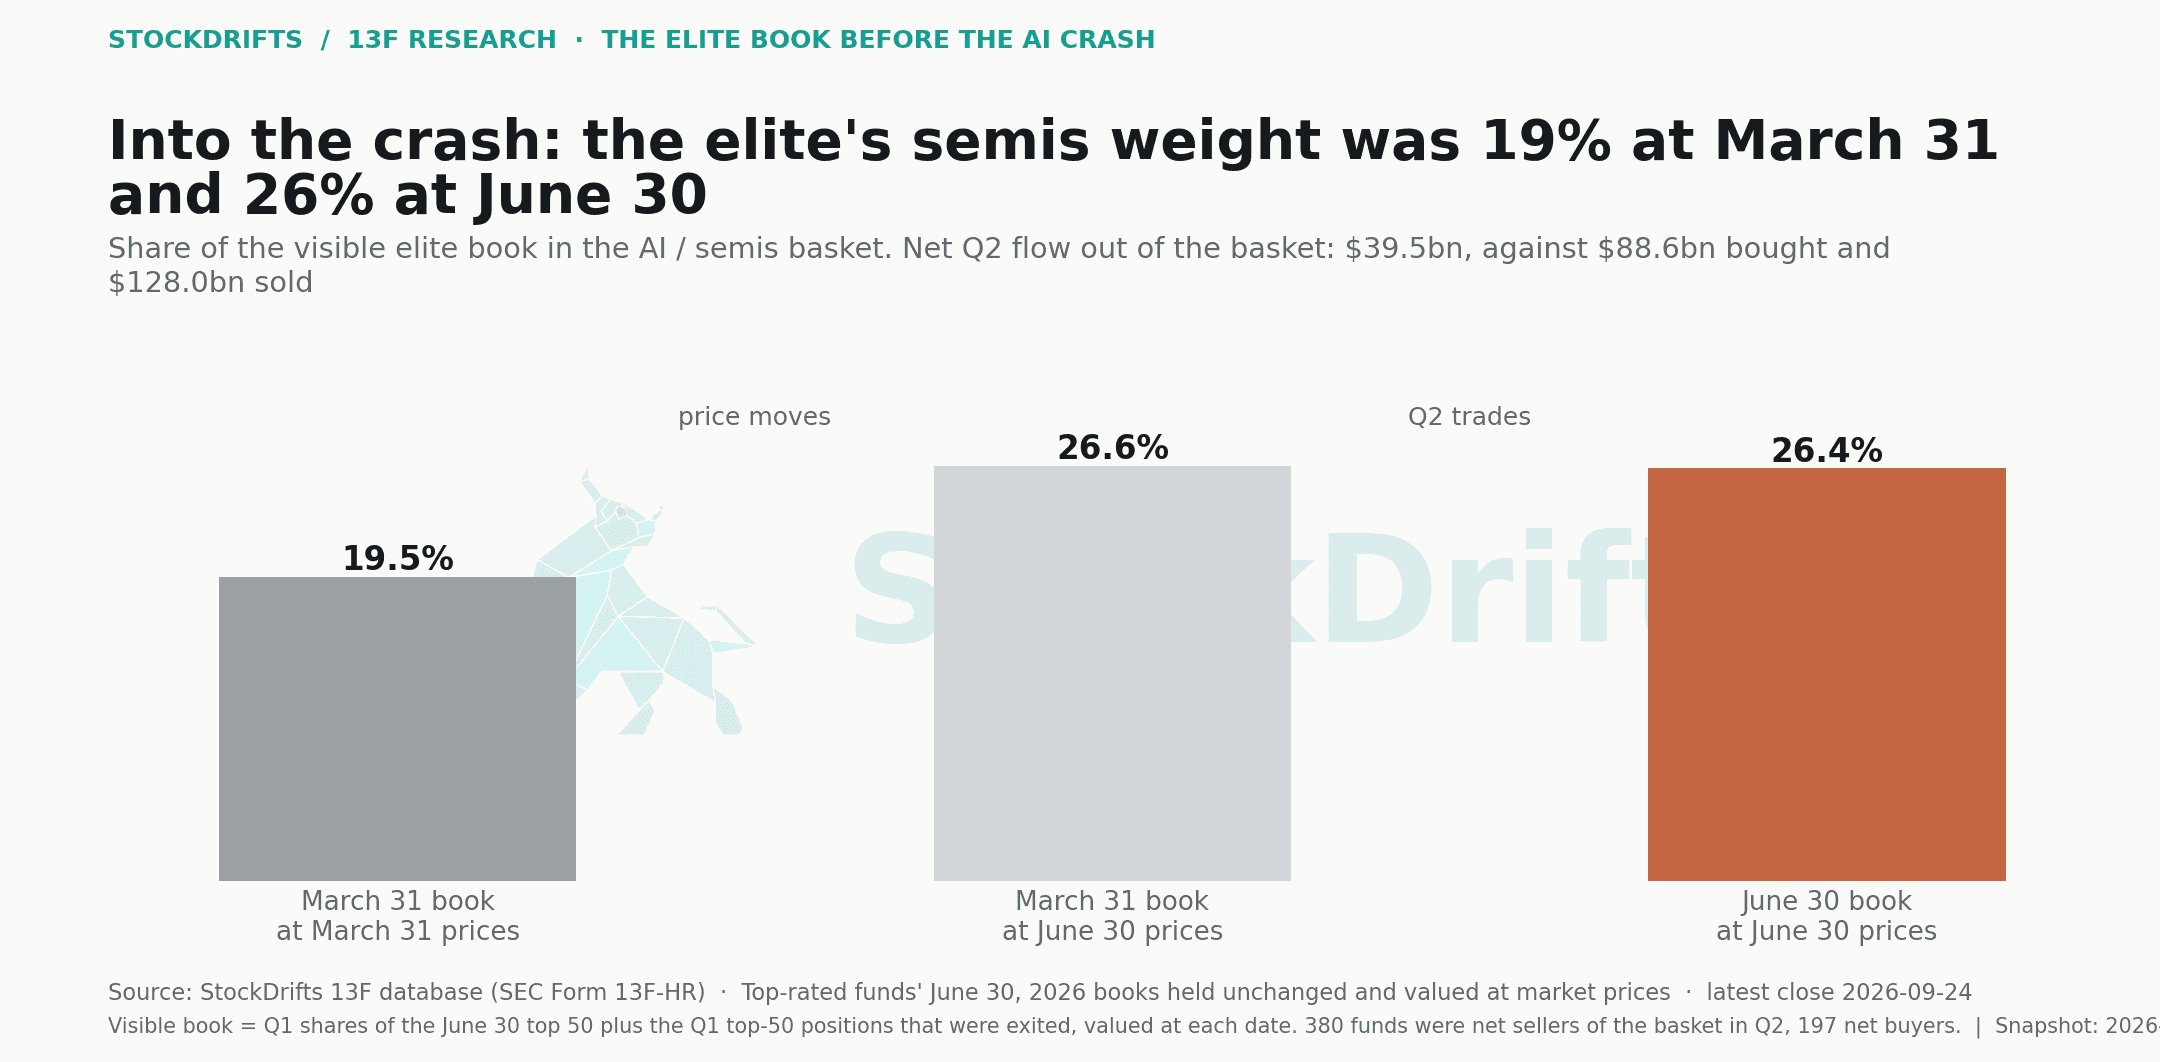
Take the 564 top-rated funds whose March 31 book can be reconstructed (Q1 shares of the June 30 top 50, plus the Q1 top-50 positions they exited). At March 31 prices the basket was 19.5% of that book. Reprice the same March 31 book at June 30 prices and it is 26.6%: the second quarter's rally in memory and semiconductor equipment did that on its own. The actual June 30 book is 26.4%. A quarter of trading moved the elite's basket weight by 0.15 points. Per fund, the median basket weight went from 15.2% at March 31 to 20.1% at June 30; 38% of funds cut their weight by more than half a point relative to the no-trade book and 27% raised it.
In dollars the elite sold $128.0bn of basket stocks in Q2 and bought $88.6bn, a net $39.5bn out of a $710.2bn position. 380 funds were net sellers of the basket and 197 net buyers. The selling was concentrated in memory: Micron, net −$18.6bn across 157 sellers, then Seagate (−$6.9bn), Sandisk (−$5.5bn), Nvidia (−$5.3bn), Lam Research and Lumentum. The buying went to Intel (net $4.2bn), Western Digital, Cisco and KLA. Sandisk then fell 55% to the trough, Micron 36%, Lam 42%; Intel, the largest net buy, fell 41%.
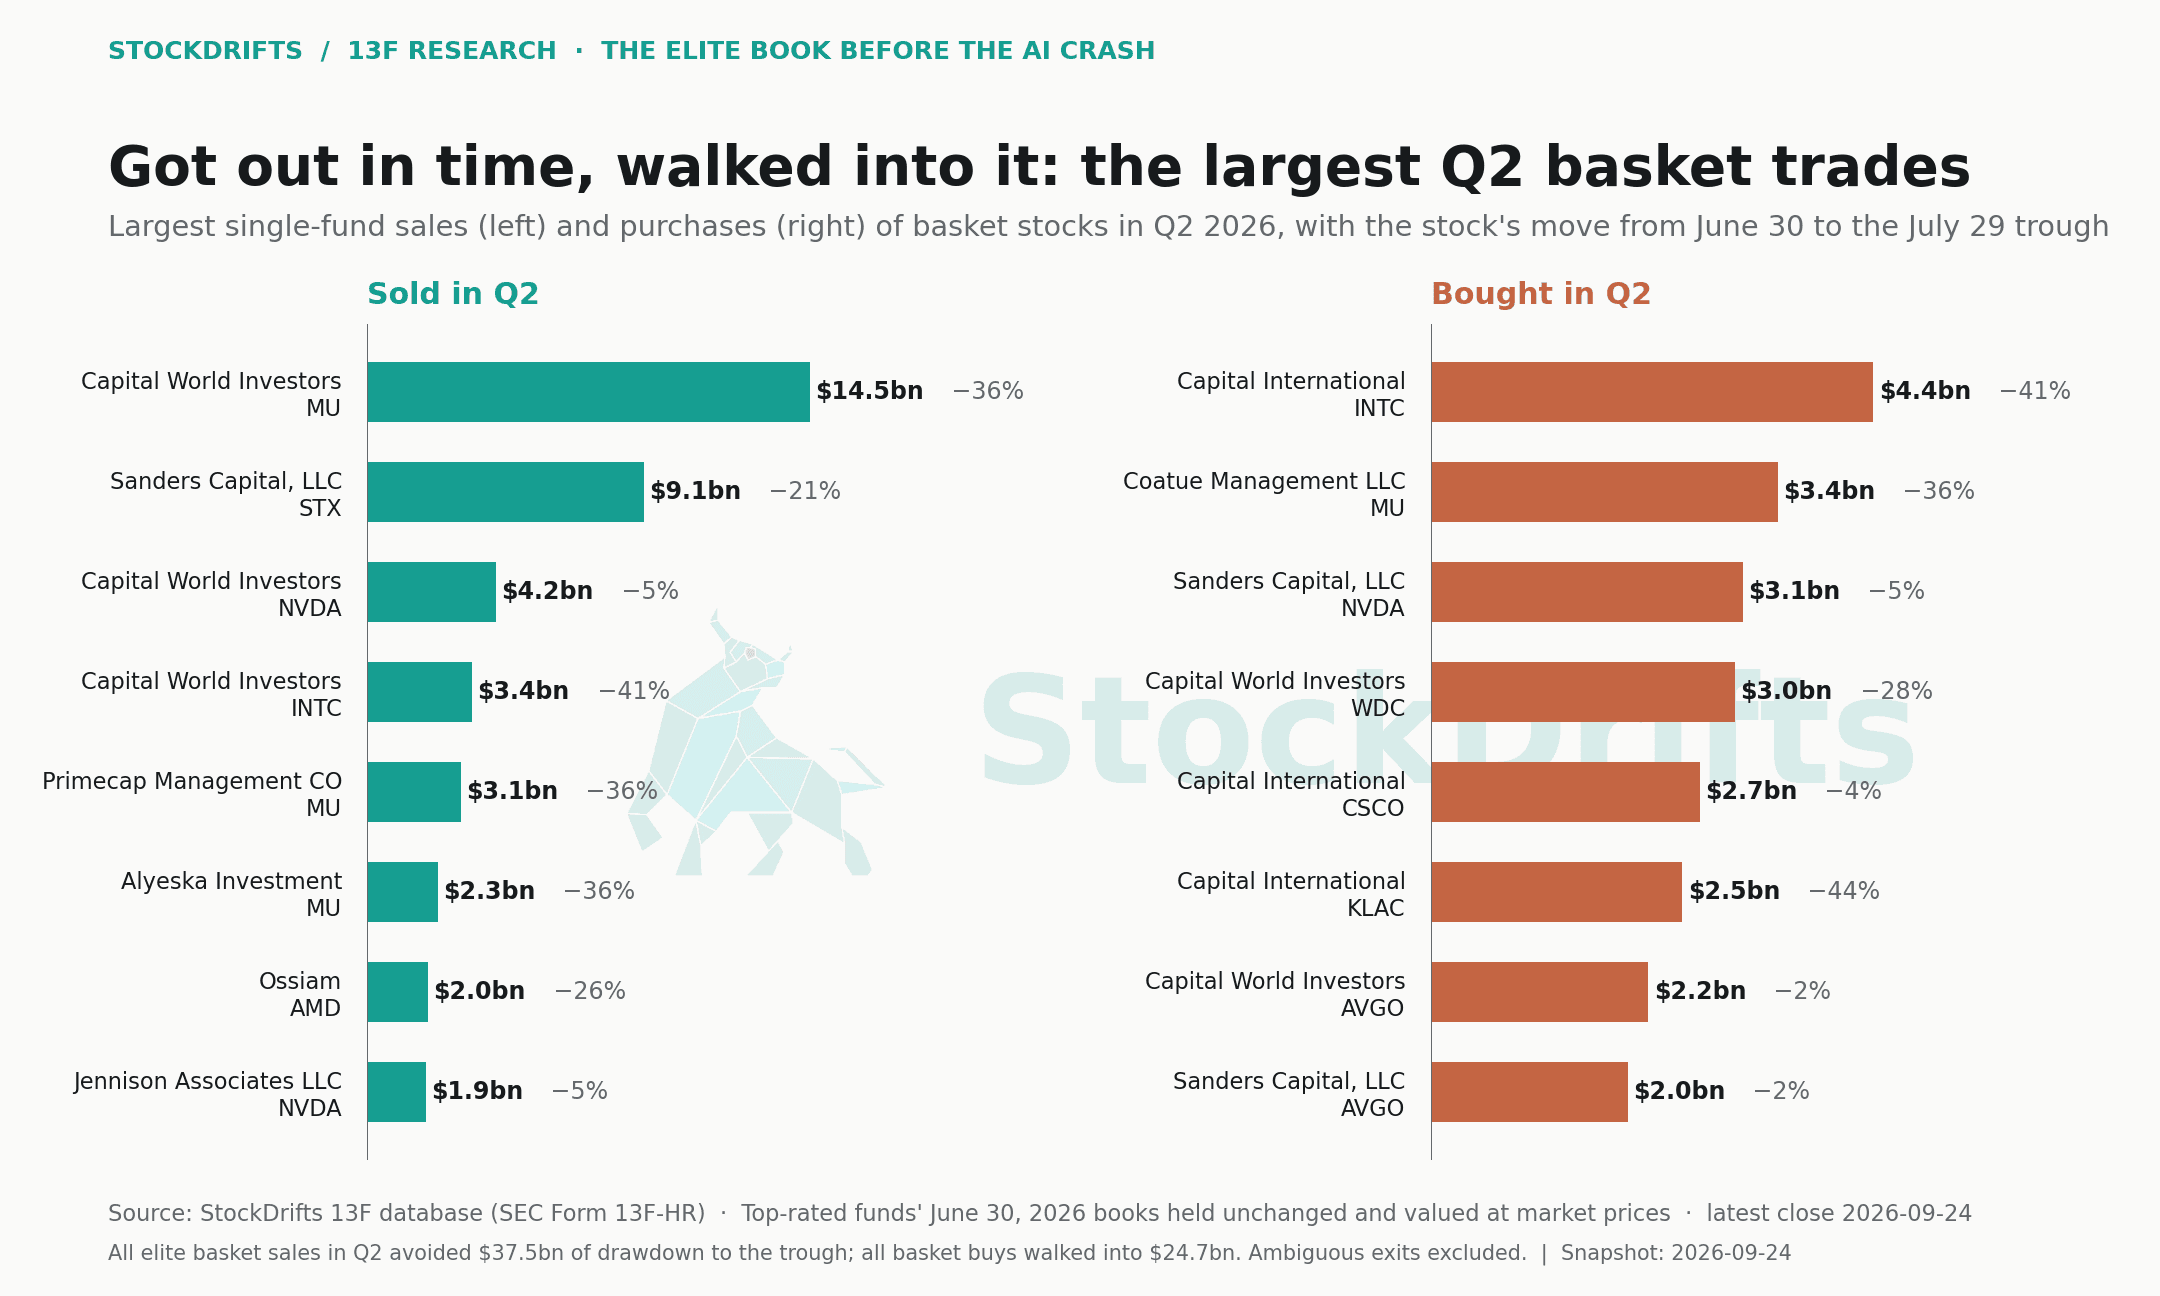
Multiply each sale by the stock's subsequent fall and the elite's basket selling avoided $37.5bn of drawdown to the trough; multiply each purchase the same way and the basket buying walked into $24.7bn. Net, the quarter's basket trades were worth $12.8bn against the $156.6bn the basket held at June 30 then lost. The largest single sales were Capital World Investors in MU ($14.5bn, which then fell 36%) and Sanders Capital, LLC in STX ($9.1bn, −21%); the largest purchases were Capital International Investors in INTC ($4.4bn, −41%) and Coatue Management LLC in MU ($3.4bn, −36%).
| Stock | Bought | Sold | Net | Sellers / buyers | To July 29 | To September 24 |
|---|---|---|---|---|---|---|
| MUMicron Technology INC | $8.6bn | $27.3bn | −$18.6bn | 157 / 93 | −36% | −8% |
| STXSeagate Technology Hldngs PL | $4.1bn | $10.9bn | −$6.9bn | 35 / 45 | −21% | −6% |
| SNDKSandisk Corp | $3.1bn | $8.6bn | −$5.5bn | 52 / 38 | −55% | −24% |
| NVDANvidia Corporation | $7.1bn | $12.4bn | −$5.3bn | 206 / 166 | −5% | +12% |
| LRCXLAM Research Corp | $1.5bn | $3.6bn | −$2.1bn | 108 / 58 | −42% | −30% |
| LITELumentum Hldgs INC | $1.6bn | $3.6bn | −$2.0bn | 61 / 24 | −30% | +8% |
| CIENCiena Corp | $253m | $1.9bn | −$1.6bn | 26 / 11 | −33% | −27% |
| AMDAdvanced Micro Devices INC | $4.7bn | $6.3bn | −$1.5bn | 122 / 93 | −26% | +6% |
| TSEMTower Semiconductor LTD | $309m | $1.7bn | −$1.4bn | 24 / 9 | −28% | −16% |
| TSMTaiwan Semiconductor Manufac | $4.8bn | $6.2bn | −$1.3bn | 95 / 99 | −22% | −6% |
| TERTeradyne INC | $263m | $1.5bn | −$1.3bn | 27 / 20 | −34% | −21% |
| ALABAstera Labs INC | $1.3bn | $2.4bn | −$1.1bn | 23 / 19 | −48% | −25% |
04 / The frozen-book test
Held unchanged, the median elite book fell 5.8%
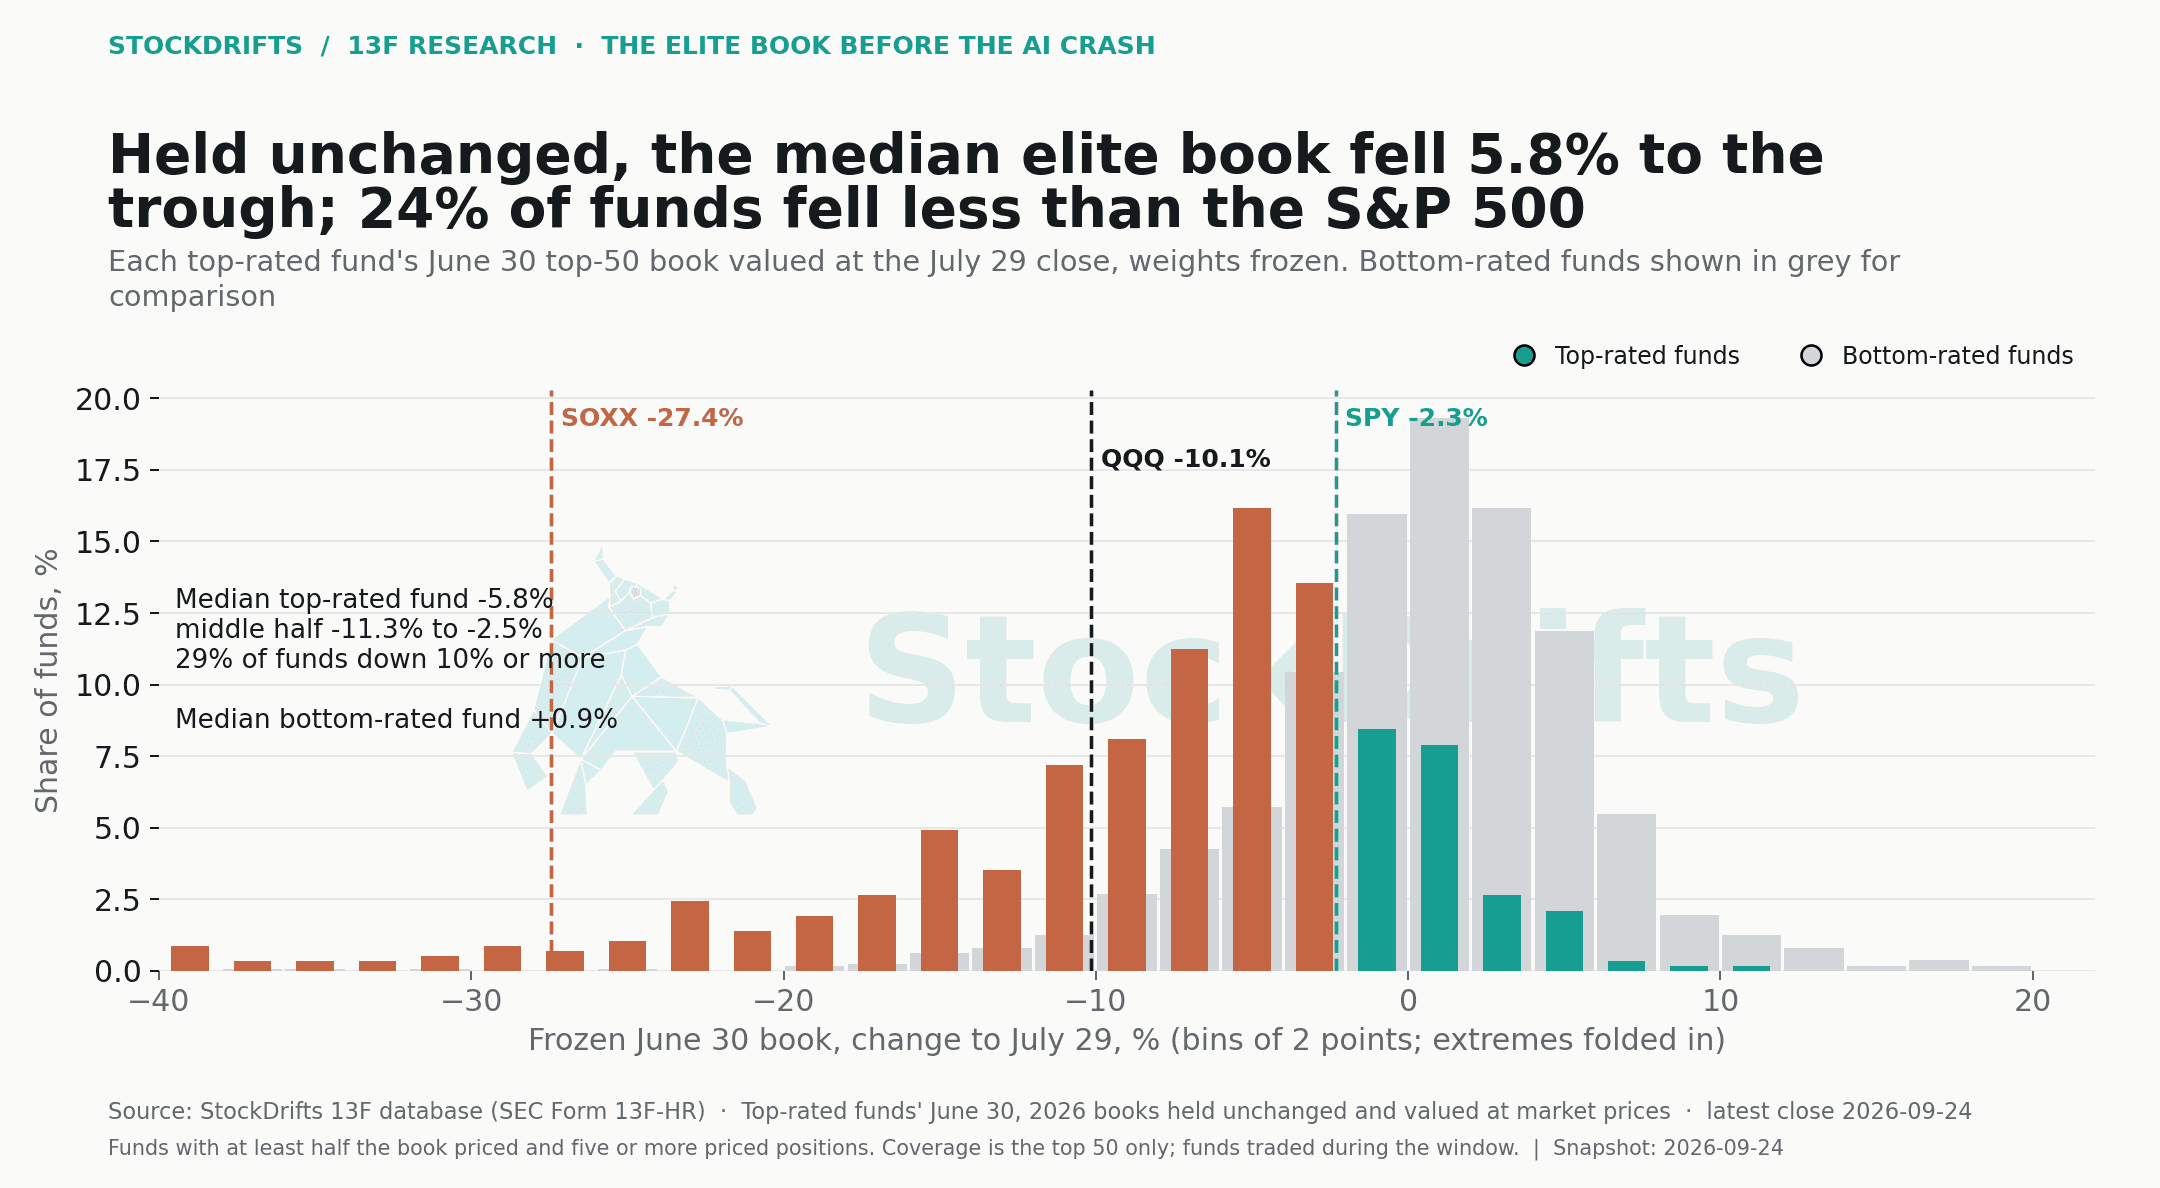
For each fund, hold the June 30 top-50 book with its June 30 weights and value it at the July 29 close and at the September 24, 2026 close. 569 top-rated funds have at least half their disclosed portfolio priced this way (median coverage 87%). The median book fell 5.8% to the trough; the middle half runs from −11.3% to −2.5%. 23.7% of books fell less than SPY's 2.3%, 71.9% fell less than QQQ's 10.1%, and 96.5% fell less than SOXX's 27.4%. 29.2% fell 10% or more; 13.4% rose.
The foil, the 1,278 bottom-rated funds, had a median book of +0.9% to the trough, and 76% of them beat SPY. That is not a fair fight and it is worth saying why: a low rating means the fund did not own the last three years' winners, which are the stocks that fell. The median bottom-rated fund had 4.9% of its book in the basket against 16.2% at the median top-rated fund.
Basket weight explains most of the spread. Top-rated funds with no basket position at all had a median book of −2.2% to the trough and 53% of them beat SPY. Under 10%: −4.6%. Ten to 20%: −5.2%. Twenty to 40%: −7.8%, with 8% beating SPY. Over 40% of the book in the basket: a median of −20.3%, 61 funds, 11% of the elite. By September 24, 2026 the order had changed: the 10-to-20% and 20-to-40% buckets had recovered to +0.4% and −0.2%, while the no-basket funds sat at −4.5%, because what they owned instead did not rally either.
| Basket weight | Funds | Share of elite | Median to July 29 | Median to September 24 | Beat SPY to trough |
|---|---|---|---|---|---|
| No basket position | 119 | 21% | −2.2% | −4.5% | 53% |
| under 10% | 86 | 15% | −4.6% | −3.6% | 34% |
| 10% to 20% | 132 | 23% | −5.2% | +0.4% | 21% |
| 20% to 40% | 171 | 30% | −7.8% | −0.2% | 8% |
| over 40% | 61 | 11% | −20.3% | −7.2% | 2% |
05 / Did the Q2 trades help?
Yes at 57% of funds, by a median of +0.2 pts
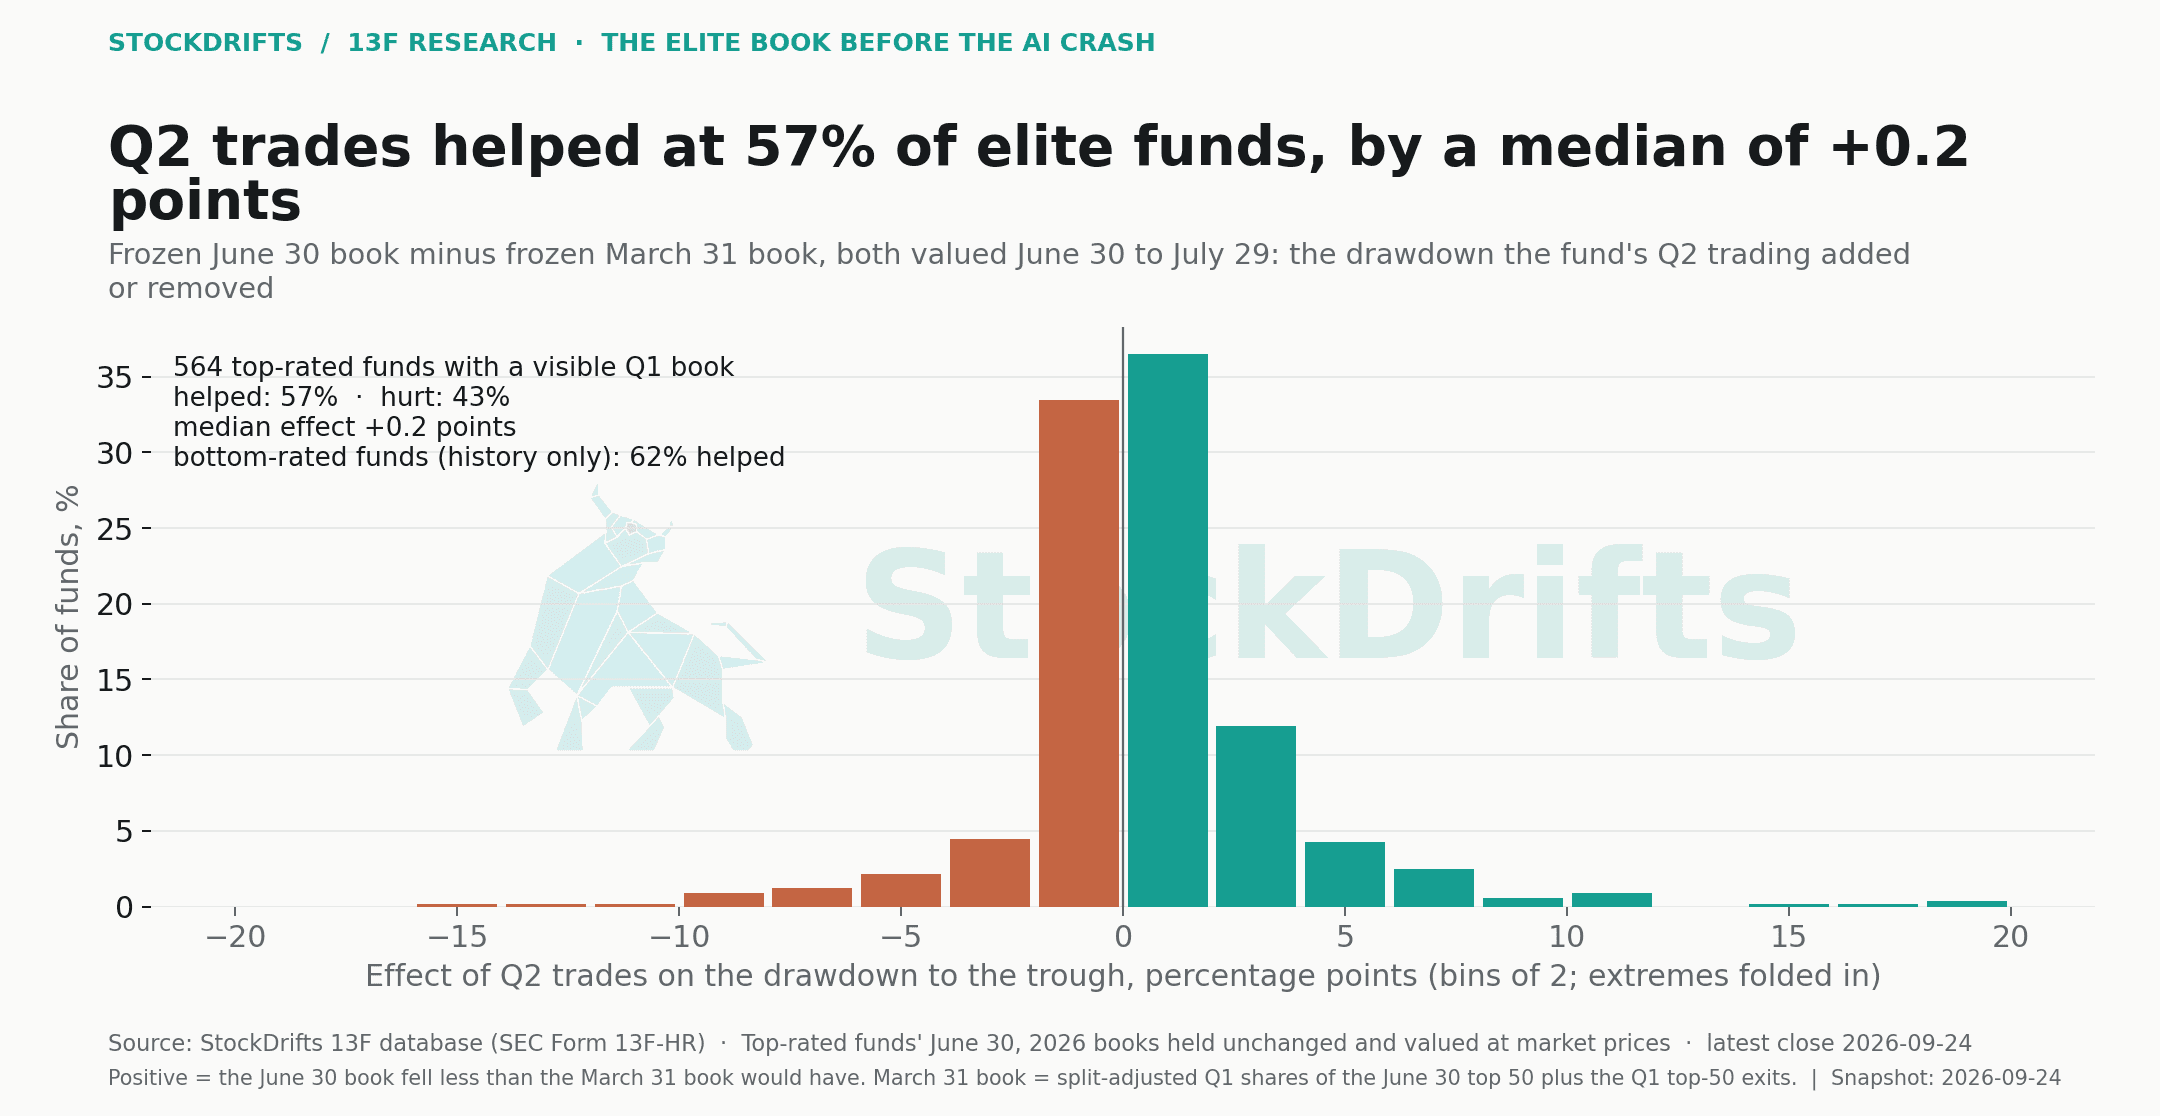
To isolate what the quarter's trading did, value each fund's March 31 book over the same window and subtract. For 564 top-rated funds with a visible March 31 book, the June 30 book fell less than the March 31 book at 56.9% of funds, and the median effect was +0.2 pts (mean +0.7 pts). In aggregate dollars the June 30 books fell 6.7% and the March 31 books 6.8%: a difference of 0.04 points. The median March 31 book fell 6.4%; had no fund traded in Q2, 20.9% would have beaten SPY instead of 23.7%. To September 24, 2026 the picture is the same: trades helped at 56% of funds by a median of +0.1 pts.
The tails are where the decisions show. Madison Avenue Partners LP (+21.0 pts: sold SNDK, ICLR · bought INVH, CPNG), Ardmore Road Asset Management LP (+16.2 pts: sold SNDK, GLW · bought GWRE, AMT) and Westerly Capital Management LLC (+14.4 pts: sold MRVL, AIP · bought COUR, ANET) sold memory, optical or semiconductor names in the quarter and would otherwise have been among the hardest hit. Ratan Capital Management LP (−14.6 pts: sold NVDA, META · bought SIMO, QCOM), Mizuho Markets Cayman LP (−11.4 pts: sold GEHC, ADI · bought MRVL, PANW) and Berkshire Capital Holdings INC (−7.1 pts: sold NVDA, COHR · bought MU, AMD) bought into the quarter's rally. The bottom-rated funds, measured on history alone (their exits are not reconstructed), were helped at 62% of funds against 64% for the top-rated on the same basis.
| Fund | Disclosed | Book to July 29 | Book to September 24 | Q2 trades | Basket | Largest positions | Q2 action |
|---|---|---|---|---|---|---|---|
| Madison Avenue Partners LP | $2.3bn | −1.4% | −7.7% | +21.0 pts | 1% | GHC 12%, INVH 11%, MKL 9% | sold SNDK, ICLR · bought INVH, CPNG |
| Ardmore Road Asset Management LP | $1.7bn | +1.2% | +9.3% | +16.2 pts | 17% | AMD 4%, GWRE 4%, TMUS 4% | sold SNDK, GLW · bought GWRE, AMT |
| Westerly Capital Management LLC | $542m | −4.3% | −3.4% | +14.4 pts | 18% | COUR 6%, VIAV 5%, ANET 4% | sold MRVL, AIP · bought COUR, ANET |
| O'Neil Global Advisors, Inc. | $447m | −12.0% | −5.6% | +11.6 pts | 11% | LLY 21%, GOOGL 15%, TSLA 8% | sold VIAV, CIEN · bought LLY, GOOGL |
| Roubaix Capital, LLC | $279m | −4.5% | −4.3% | +10.3 pts | 3% | SXT 4%, TKNO 3%, BLFS 3% | sold VPG, ALGM · bought BLFS, ATS |
| Kora Management LP | $843m | +1.4% | +5.0% | +9.3 pts | 0% | SE 43%, NBIS 15%, NU 12% | sold NBIS · bought U, SE |
| Ophir Asset Management Pty LTD | $1.2bn | −7.4% | −0.3% | +8.7 pts | 5% | MRX 7%, SXI 6%, VVX 5% | sold PENG, SIMO · bought TH, AVNT |
| Divisar Capital Management LLC | $434m | −16.8% | −19.4% | +7.6 pts | 34% | ONTO 10%, PII 8%, MKSI 6% | sold UCTT, ONTO · bought CALY, VERX |
| Blue Grotto Capital, LLC | $1.2bn | −3.3% | −2.3% | +7.4 pts | 10% | SN 8%, TLN 8%, TSM 7% | sold MKSI, AKAM · bought RDDT, BKD |
| Discovery Capital Management LLC Ct | $2.4bn | −12.9% | −10.2% | +6.9 pts | 22% | SNDK 20%, BAP 4%, AMX 4% | sold MU, LRCX · bought AMC, TE |
| Fund | Disclosed | Book to July 29 | Book to September 24 | Q2 trades | Basket | Largest positions | Q2 action |
|---|---|---|---|---|---|---|---|
| Ratan Capital Management LP | $310m | −25.9% | −14.3% | −14.6 pts | 42% | SIMO 13%, VST 8%, AMZN 7% | sold NVDA, META · bought SIMO, QCOM |
| Wealth High Governance Capital LTDA | $334m | −22.4% | −16.6% | −13.4 pts | 14% | GNRC 7%, GLW 5%, PH 5% | sold PAAS, FIX · bought GNRC, GLW |
| Mizuho Markets Cayman LP | $2.7bn | −14.6% | +6.2% | −11.4 pts | 37% | MRVL 21%, DELL 11%, MSFT 7% | sold GEHC, ADI · bought MRVL, PANW |
| Think Investments LP | $847m | −20.3% | −11.2% | −9.5 pts | 45% | MRVL 14%, AMZN 10%, LRCX 8% | sold OGN, CLS · bought LRCX, WOLF |
| Soros Capital Management LLC | $559m | −21.9% | −16.1% | −8.3 pts | 38% | MU 8%, TSM 7%, CAT 6% | sold FIX, GEV · bought MU, TSM |
| Berkshire Capital Holdings INC | $462m | −37.7% | −17.5% | −7.1 pts | 76% | MU 8%, TSM 8%, AMD 8% | sold NVDA, COHR · bought MU, AMD |
| Geneva Partners, LLC | $375m | −24.4% | −10.6% | −6.8 pts | 37% | DELL 5%, MRVL 5%, GOOGL 5% | sold LLY, AAOI · bought MRVL, TER |
| Steadview Capital Management LLC | $333m | −16.5% | −5.2% | −6.6 pts | 20% | HOOD 17%, CVNA 15%, HUT 13% | sold SHOP, HOOD · bought MU, ASML |
| Incline Global Management LLC | $357m | −14.3% | −4.8% | −6.4 pts | 35% | FTAI 8%, LITE 7%, COHR 7% | sold CRDO, NCLH · bought FTAI, LITE |
| Redwood Capital Management LLC | $927m | −10.3% | −11.9% | −6.3 pts | 21% | VSAT 21%, SATS 14%, GBTG 11% | sold GBTG, SATS · bought VSAT, MBC |
06 / Held up best
The books that rose through the trough had almost nothing in semis
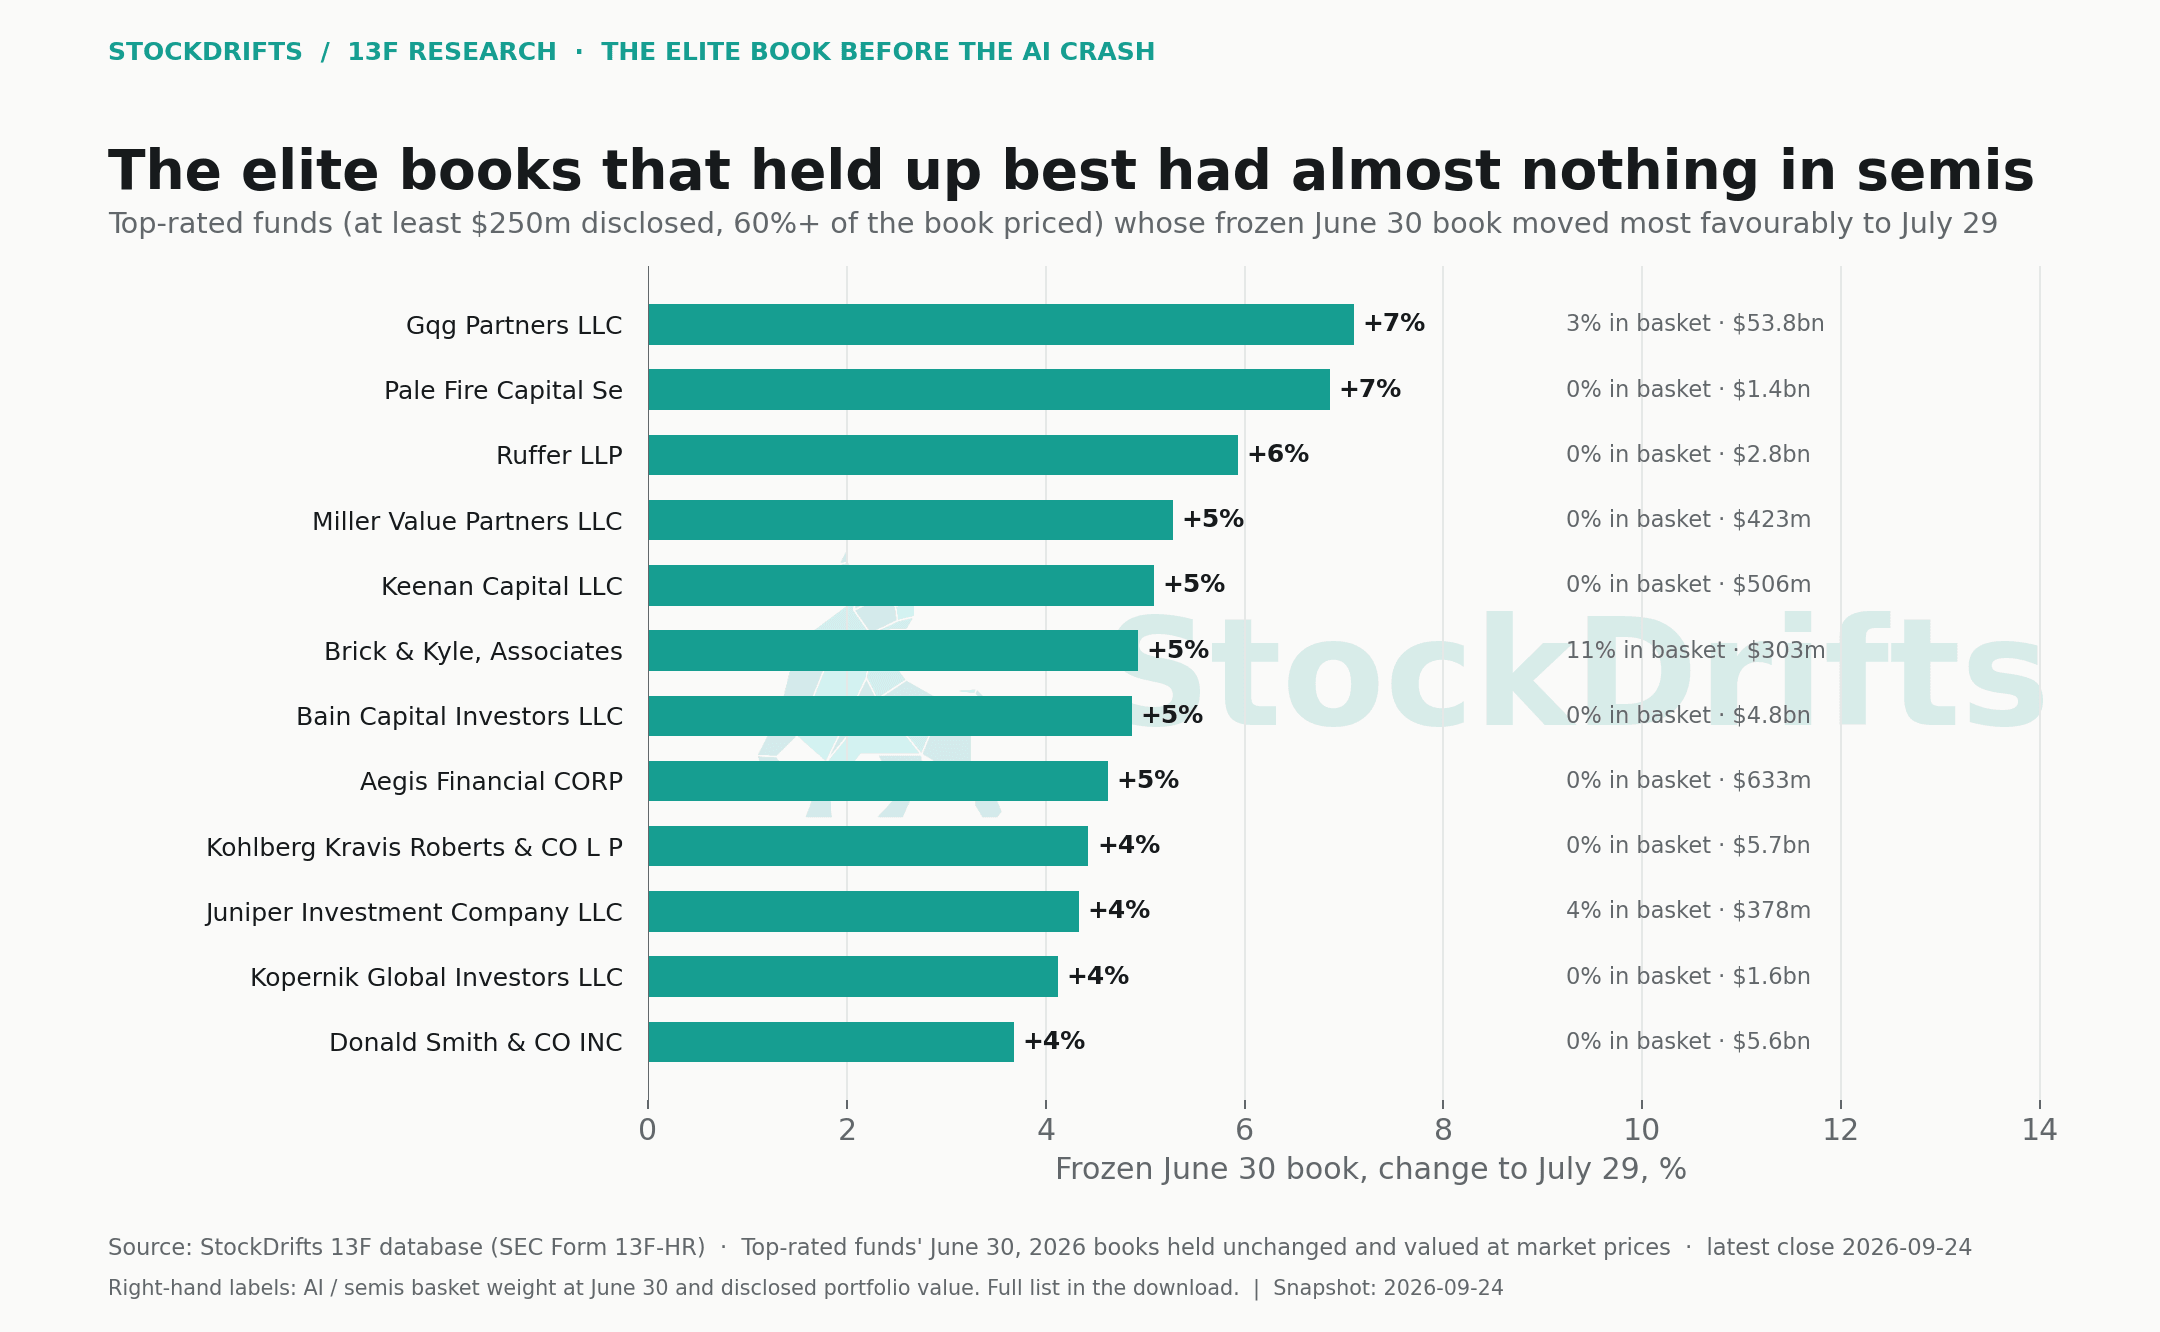
Restrict the list to investable funds: at least $250m disclosed, eight or more positions, at least 60% of the book priced, no fund with more than half the book in one stock, and no venture, charitable, endowment or pension filers. 398 top-rated funds qualify; 22% of them beat SPY to the trough. The twenty whose frozen June 30 book moved most favourably are led by Gqg Partners LLC (+7.1%, PM 15%, CB 8%, PBR 6%), Pale Fire Capital Se (+6.9%), Ruffer LLP (+5.9%), Miller Value Partners LLC and Keenan Capital LLC. Of the twenty, 17 had under 1% of the book in the basket. These are tobacco, energy, banks, emerging markets, small-cap value and private-equity sponsor stakes: books built to own something other than the AI trade.
| Fund | Disclosed | Book to July 29 | Book to September 24 | Q2 trades | Basket | Largest positions | Q2 action |
|---|---|---|---|---|---|---|---|
| Gqg Partners LLC | $53.8bn | +7.1% | +5.6% | +0.1 pts | 3% | PM 15%, CB 8%, PBR 6% | sold JNJ, ENB · bought XOM, CVS |
| Pale Fire Capital Se | $1.4bn | +6.9% | +3.4% | +0.9 pts | 0% | GRPN 17%, BTG 17%, ZD 10% | sold BAX, LQDA · bought COUR, BABA |
| Ruffer LLP | $2.8bn | +5.9% | +8.6% | +0.5 pts | 0% | AMZN 7%, MSFT 6%, BABA 4% | sold COIN, GE · bought AMZN, NTES |
| Miller Value Partners LLC | $423m | +5.3% | +6.3% | +0.8 pts | 0% | NBR 9%, GTN 7%, BLMN 6% | sold BFH, TDAY · bought COTY, GTN |
| Keenan Capital LLC | $506m | +5.1% | +16.3% | −1.6 pts | 0% | APP 19%, GLBE 13%, APPF 11% | sold DT, CWAN · bought TOST, GOOG |
| Brick & Kyle, Associates | $303m | +4.9% | +8.8% | +0.0 pts | 11% | AAPL 11%, NVDA 9%, MSFT 3% | bought HON |
| Bain Capital Investors LLC | $4.8bn | +4.9% | +3.3% | +0.0 pts | 0% | BOBS 31%, SGRY 17%, AVAH 15% | no change in the top 50 |
| Aegis Financial CORP | $633m | +4.6% | +11.0% | −0.2 pts | 0% | CVE 14%, PDS 6%, EQX 6% | sold EQX, NGS · bought PK, RDN |
| Kohlberg Kravis Roberts & CO L P | $5.7bn | +4.4% | −3.7% | +0.8 pts | 0% | BTSG 33%, HSIC 23%, BBIO 17% | sold BTSG, PPLCU |
| Juniper Investment Company LLC | $378m | +4.3% | −3.3% | +2.0 pts | 4% | LINC 23%, ALNT 21%, BVS 17% | sold LINC, ALNT · bought AORT, OFIX |
| Kopernik Global Investors LLC | $1.6bn | +4.1% | +7.9% | +4.6 pts | 0% | RRC 15%, EXE 10%, KT 10% | sold SA, CNC · bought RRC, EXE |
| Donald Smith & CO INC | $5.6bn | +3.7% | +7.0% | +0.1 pts | 0% | AER 8%, EGO 5%, CGAU 4% | sold SPNT, TPC · bought MOS, EGO |
| Fj Capital Management LLC | $770m | +3.6% | −1.0% | +0.6 pts | 0% | SFST 7%, EQBK 6%, NIC 6% | sold RBB, EBC · bought BOH, TFC |
| Azora Capital LP | $2.4bn | +3.6% | +0.7% | +6.3 pts | 0% | BAC 10%, BEN 10%, VLY 6% | sold VIRT, RIOT · bought BAC, STT |
| Junto Capital Management LP | $5.7bn | +3.3% | −3.6% | +3.0 pts | 1% | ORLY 3%, WMT 3%, FWONK 3% | sold MAR, AMAT · bought ORLY, V |
| Gator Capital Management LLC | $477m | +3.1% | −0.1% | −0.6 pts | 0% | HOOD 9%, COMP 7%, FCNCA 4% | sold NBN, VCTR · bought NAVI, UPST |
| Salzhauer Michael | $292m | +2.9% | −2.7% | +2.5 pts | 0% | BAC 31%, C 8%, PNFP 6% | sold C, BAC · bought PNFP, COF |
| Sagil Capital LLP | $280m | +2.7% | +4.4% | −0.6 pts | 0% | VIST 19%, GGAL 16%, ZIM 8% | sold TEO, TEN · bought VIST, GGAL |
| Private Capital Advisors, Inc. | $1.1bn | +2.3% | +4.4% | +0.4 pts | 0% | LLY 43%, AAPL 7%, GOOGL 6% | sold XOM, PTCT · bought MSFT, NDAQ |
| Himalaya Capital Management LLC | $3.7bn | +2.0% | −1.4% | +0.8 pts | 0% | GOOGL 25%, GOOG 23%, PDD 22% | sold BAC, OXY · bought PDD, BRK.B |
07 / Hardest hit
The semiconductor specialists: books down 24% to 38%
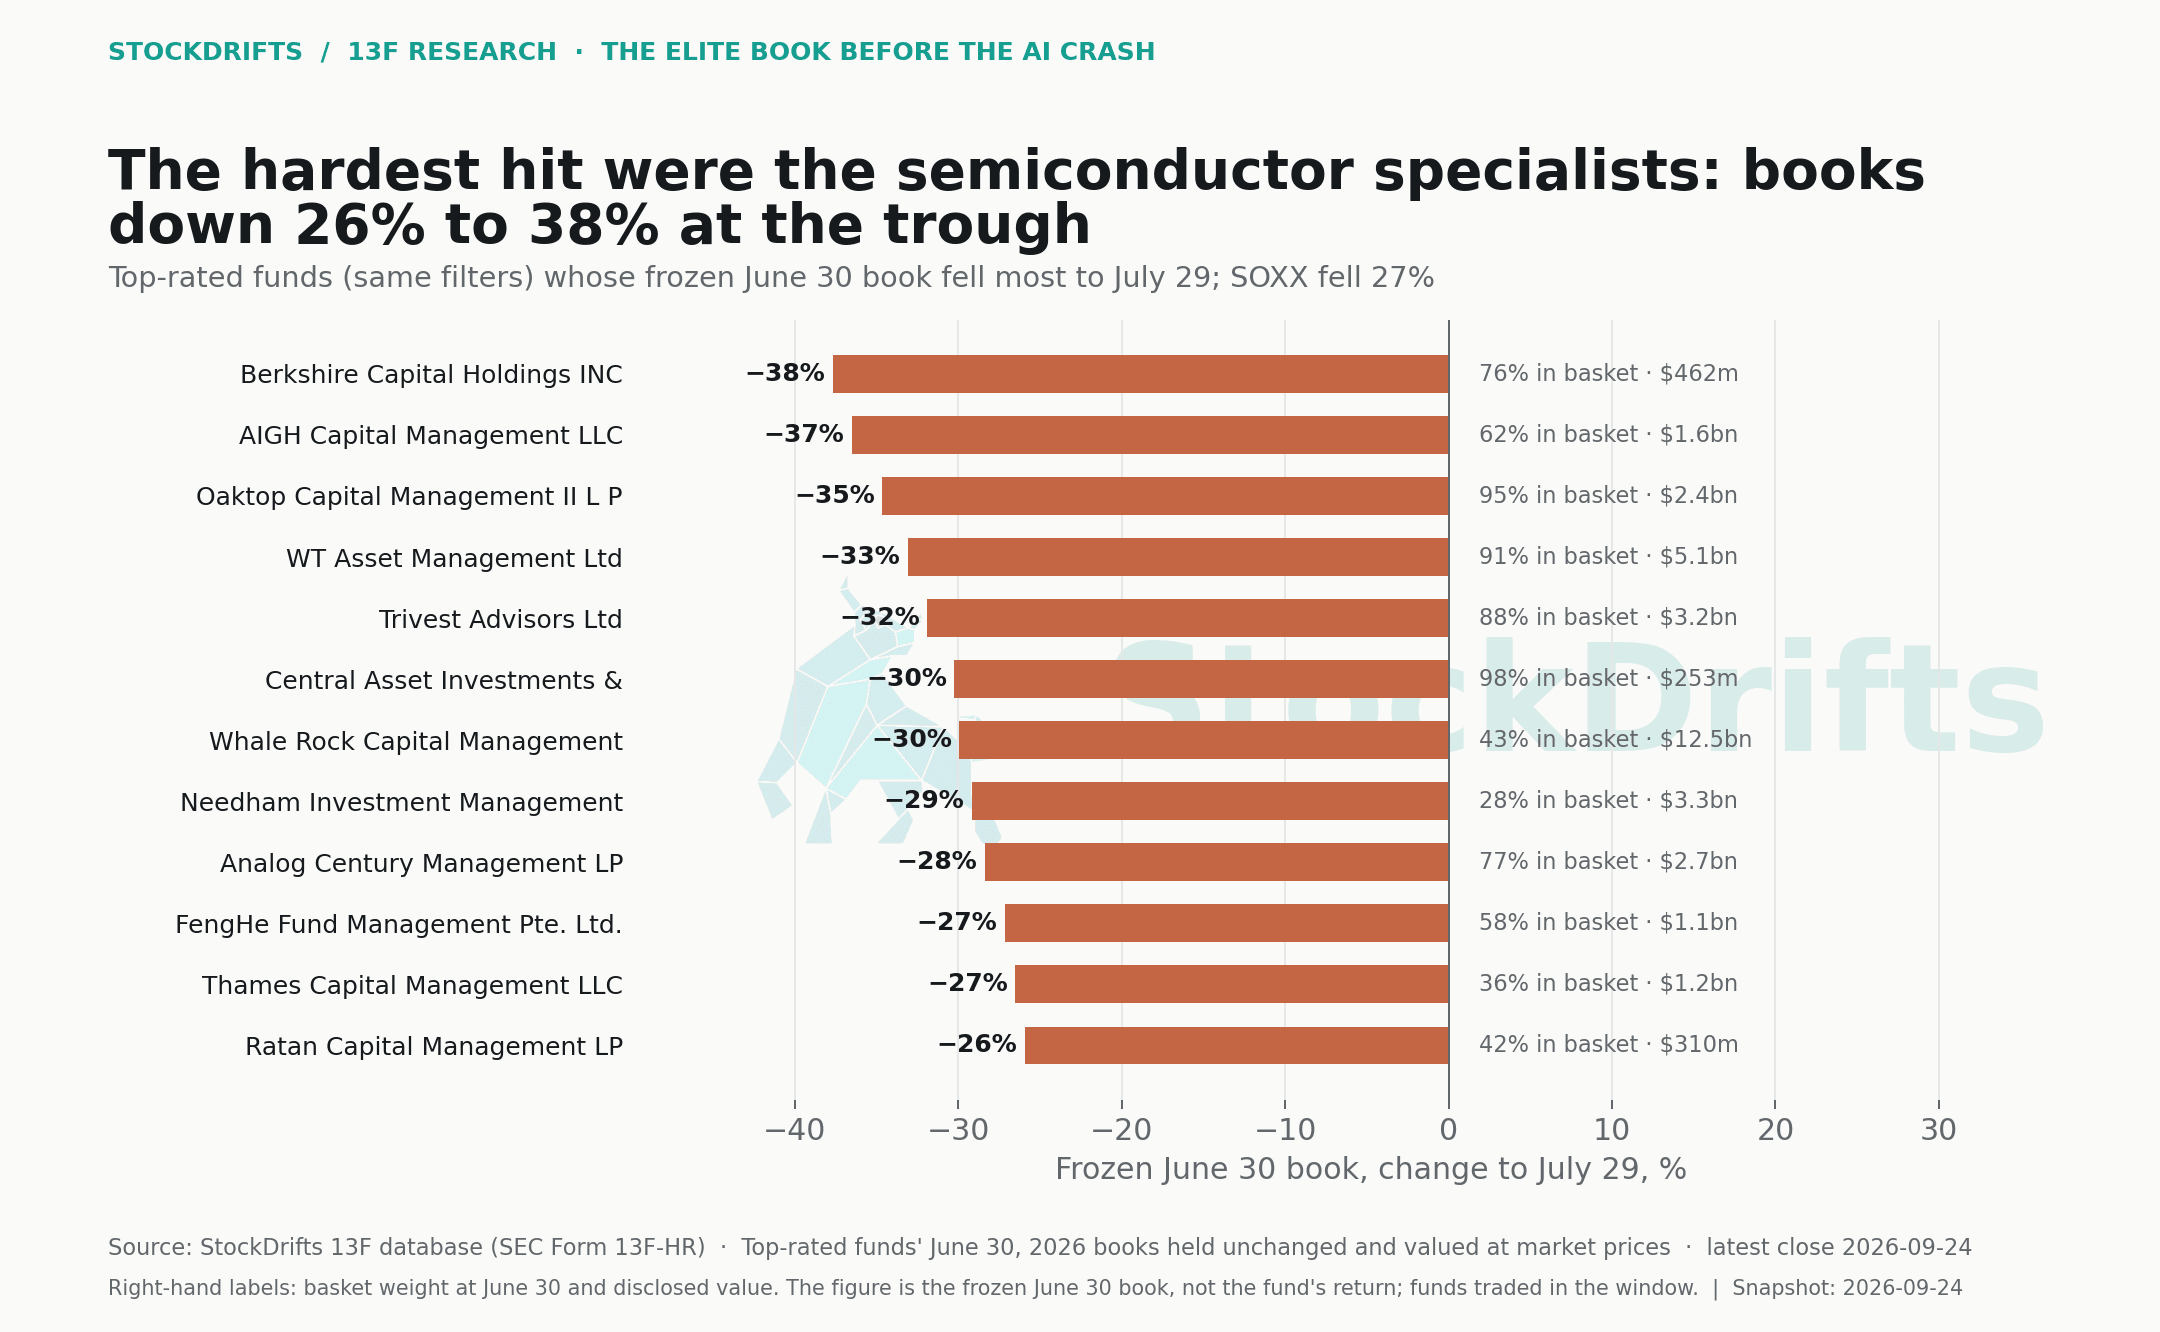
The other end of the same list is a roll-call of semiconductor and memory specialists. Berkshire Capital Holdings INC (−37.7%, 76% in the basket), AIGH Capital Management LLC (−36.5%, SNDK 31%, MXL 9%, INTC 8%), Oaktop Capital Management II L P (−34.6%, KLAC 39%, LRCX 38%, ADI 8%), WT Asset Management Ltd (−33.1%, 91% in the basket), Trivest Advisors Ltd (−31.9%, STX 22%, MU 22%, WDC 20%). Whale Rock Capital Management LLC, the largest fund on the list at $12.5bn, was −29.9% with 43% in the basket. Every one of the fifteen had at least 28% of the book in the basket at June 30.
Two things about this list. First, several of these funds did sell in Q2: Oaktop Capital Management II L P sold LRCX, KLAC · bought PINS, WT Asset Management Ltd sold SNDK, COHR · bought STM, AMAT, Trivest Advisors Ltd sold TER, MU · bought STX, WDC. Their Q2 trades helped by +3.3 pts and +1.7 pts, but a specialist rotating within the basket cannot trade its way out of the basket. Second, these are the funds that earned their rating by owning this trade for three years; the cost-basis study found the median top-rated Micron holder far above its estimated purchase price at June 30. A 36% fall from there is a drawdown, not a loss.
| Fund | Disclosed | Book to July 29 | Book to September 24 | Q2 trades | Basket | Largest positions | Q2 action |
|---|---|---|---|---|---|---|---|
| Berkshire Capital Holdings INC | $462m | −37.7% | −17.5% | −7.1 pts | 76% | MU 8%, TSM 8%, AMD 8% | sold NVDA, COHR · bought MU, AMD |
| AIGH Capital Management LLC | $1.6bn | −36.5% | −15.4% | −0.2 pts | 62% | SNDK 31%, MXL 9%, INTC 8% | sold SNDK, GNRC · bought MXL, INTC |
| Oaktop Capital Management II L P | $2.4bn | −34.6% | −27.0% | +0.3 pts | 95% | KLAC 39%, LRCX 38%, ADI 8% | sold LRCX, KLAC · bought PINS |
| WT Asset Management Ltd | $5.1bn | −33.1% | −17.0% | +3.3 pts | 91% | SNDK 11%, STX 11%, WDC 10% | sold SNDK, COHR · bought STM, AMAT |
| Trivest Advisors Ltd | $3.2bn | −31.9% | −15.2% | +1.7 pts | 88% | STX 22%, MU 22%, WDC 20% | sold TER, MU · bought STX, WDC |
| Central Asset Investments & Management Holdings (HK) Ltd | $253m | −30.2% | −15.6% | +5.9 pts | 98% | WDC 28%, STX 27%, MU 21% | sold SNDK, MU · bought STX, WDC |
| Whale Rock Capital Management LLC | $12.5bn | −29.9% | −13.8% | −0.4 pts | 43% | SNDK 11%, AMD 7%, GOOGL 7% | sold SNDK, AEIS · bought AMD, ALAB |
| Needham Investment Management LLC | $3.3bn | −29.2% | −29.6% | +0.0 pts | 28% | VICR 6%, AIP 6%, VSH 5% | sold FORM, ASPN · bought CECO, TTI |
| Analog Century Management LP | $2.7bn | −28.4% | −12.0% | −0.2 pts | 77% | AMAT 6%, APH 5%, TSM 5% | sold ARM, NOK · bought ONTO, ADI |
| FengHe Fund Management Pte. Ltd. | $1.1bn | −27.1% | −23.4% | −1.4 pts | 58% | MKSI 25%, TXN 16%, CRDO 16% | sold BWXT, TER · bought TXN, CRDO |
| Thames Capital Management LLC | $1.2bn | −26.5% | −15.3% | −1.4 pts | 36% | STT 5%, GE 4%, MU 4% | sold DOCN, SNDK · bought AMD, NBIS |
| Ratan Capital Management LP | $310m | −25.9% | −14.3% | −14.6 pts | 42% | SIMO 13%, VST 8%, AMZN 7% | sold NVDA, META · bought SIMO, QCOM |
| Riposte Capital LLC | $451m | −25.4% | −17.6% | +0.3 pts | 49% | MU 10%, RACE 8%, CIEN 7% | sold ALAB, LRCX · bought RACE, CIEN |
| Geneva Partners, LLC | $375m | −24.4% | −10.6% | −6.8 pts | 37% | DELL 5%, MRVL 5%, GOOGL 5% | sold LLY, AAOI · bought MRVL, TER |
| Bit Capital GMBH | $3.4bn | −24.1% | −4.0% | −1.9 pts | 39% | IREN 11%, AMZN 8%, MU 7% | sold AMD, HUT · bought SNDK, HOOD |
08 / The verdict
Did the elite navigate it? Not as a group. They were diversified, not early
Three numbers answer the question. 76.3% of top-rated books fell more than the S&P 500 to the trough, and 29.2% fell 10% or more. The basket weight the elite carried into the crash was a product of price, not purchases: 19.5% at March 31, 26.6% by June 30 with no trades, 26.4% after the quarter's trades. And the quarter's trading, taken as a whole, was worth 0.04 points of drawdown in aggregate and +0.2 pts at the median fund, with 57% helped and 43% hurt. The basket selling avoided $37.5bn; the basket buying gave $24.7bn of it back.
What the elite did have was a book that was never all semis. 96.5% of top-rated books fell less than SOXX and 71.9% less than QQQ, because the median fund held 16% in the basket, not 100%, and the two largest basket positions (Nvidia, Broadcom) fell 5% and 2% against the basket's 22%. By September 24, 2026 the median top-rated book was −1.7% against June 30, with SPY at +2.9%, QQQ at +0.5% and SOXX at −12.4%; 41% of books were above their June 30 value. Still, 41% of top-rated funds held 20% or more of the book in the basket at June 30, and 64% held 10% or more. If the question is whether the best-rated 13F filers sold the top, the answer in the filings is no.
09 / Explore the evidence
Every top-rated fund
Search the 569 top-rated funds with a priced June 30 book. Columns: the frozen June 30 book's move to July 29 and to September 24, 2026, the effect of Q2 trades in points (June 30 book minus March 31 book, to the trough), the basket weight at June 30, and the share of the disclosed portfolio covered by priced top-50 positions.
Loading the table… · top-rated funds with at least half the book priced
| Fund | Rating | Disclosed | Book to July 29 | Book to latest | Q2 trades, pts | Basket % | Coverage % |
|---|
Nothing matches these filters.
10 / Methodology & limitations
Exactly what went into this study
The window. Daily adjusted closes from Yahoo Finance. The trough is the SOXX low after June 30 (July 29, 2026); SPY and QQQ are measured on the same date, not at their own lows. The second window runs to September 24, 2026. Every valuation uses the ratio of a stock's close to its June 30 close, which is unaffected by splits; the June 30 dollar level comes from the filing (value divided by shares). 29 tickers show a split or reverse split after June 30 when Yahoo's June 30 close is compared with the filing-implied price (Amphenol 2:1, CrowdStrike 4:1, Monster 2:1 among them); they need no correction under the ratio method. 30 tickers whose Yahoo price does not reconcile with the filing at any plausible split ratio are left unpriced. 99.5% of elite dollars are priced. A stock delisted in the window is carried at its last close.
The frozen book. Each fund's June 30 top-50 positions (common stock only, ETFs and non-equity classes removed, implied-price guard applied), held with June 30 weights and revalued. A fund enters the distributions when at least half of its disclosed portfolio is priced and it has five or more priced positions (569 top-rated, 1,278 bottom-rated). Coverage is reported per fund and is the top 50 only. The result is a disclosed long book at market prices, not the fund's NAV: it ignores trades made after June 30, positions outside the top 50, cash, shorts, options and non-US listings.
The March 31 book. Split-adjusted Q1 share counts from each June 30 position's filing history, plus the Q1 top-50 positions the fund no longer held, from the Q2 flow study (already split-adjusted for KLA 10:1, Booking 25:1, Carvana 5:1 and Powell 3:1). Exits are included whether or not they may only have slipped below the top 50. The Q2-trade effect is the June 30 book's move minus the March 31 book's move over the same window, available for 564 top-rated funds. For bottom-rated funds exits are not reconstructed, so their effect is computed on history alone and is labelled as such.
The basket. Semiconductors, computer hardware and communication equipment by Financial Modeling Prep industry label, with no hand-picked additions or removals. Adjacent AI-infrastructure industries fell as hard (electrical equipment & parts −34%, hardware, equipment & parts −29%, engineering & construction −27%) and are not in it; the basket understates the elite's AI exposure rather than overstating it.
Flows. Share change times the June 30 price, from the flow study's position-level table; exits classified as ambiguous (small stakes that may have slipped below the top 50) are excluded from the dollar flows and the named sell list. "Drawdown avoided" is dollars sold times the stock's fall to the trough; "walked into" is dollars bought times the same fall. Neither is a realized figure.
Who is in. Top-rated is four stars or better with 12 or more quarters, from the same active-picker universe as the other articles in this series; bottom-rated is two and a half stars or below. Named lists require $250m disclosed, eight or more positions, 60% or more of the book priced, no position over half the book, and no venture, charitable, endowment or pension filers (398 funds).
Sources. StockDrifts 13F database (SEC Form 13F-HR, all filers), snapshot September 24, 2026, filings through September 11, 2026; prices from Yahoo Finance; industry labels from Financial Modeling Prep. Scripts, intermediate tables and the summary file are published alongside this article.
11 / Questions
Questions this study answers
- Did hedge funds sell before the AI crash in 2026?
- Only at the margin. Between March 31 and June 30, 2026 the four- and five-star 13F funds sold $128.0bn of semiconductor, hardware and communication-equipment stocks and bought $88.6bn, a net $39.5bn out of a $710.2bn position. 380 funds were net sellers of the basket and 197 net buyers. The basket's weight in the elite book was 26.4% on June 30 against 26.6% if no trades had been made, so the quarter's trading reduced exposure by less than a fifth of a point.
- What did hedge funds own before the AI crash?
- At June 30, 2026 the top-rated funds' largest combined positions were Nvidia ($133.0bn, 383 holders), Broadcom ($115.6bn), Micron ($96.0bn), Microsoft, Amazon, Alphabet, Apple, Meta, TSMC and Eli Lilly. 26.3% of the $2.70tn disclosed in top-50 positions sat in semiconductors, computer hardware and communication equipment, the industries that then fell 22.1% to the July 29 low. The median top-rated fund had 16.2% of its book in that basket; 41% of funds had 20% or more.
- How did hedge funds do in the 2026 semiconductor selloff?
- Held unchanged from June 30 to July 29, 2026, the median top-rated fund's disclosed book fell 5.8%, against −2.3% for SPY, −10.1% for QQQ and −27.4% for SOXX. 23.7% of top-rated books fell less than the S&P 500, 71.9% less than the Nasdaq-100 and 96.5% less than the semiconductor index. 29.2% fell 10% or more. By September 24, 2026 the median book was −1.7% versus June 30. These are frozen disclosed long books at market prices, not fund returns.
- Which hedge funds were hit hardest by the AI stock crash?
- Among top-rated funds with at least $250m disclosed, the frozen June 30 books that fell most to July 29, 2026 belonged to semiconductor specialists: Berkshire Capital Holdings INC (−38%, 76% in the basket), AIGH Capital Management LLC (−37%, 62% in the basket), Oaktop Capital Management II L P (−35%, 95% in the basket), WT Asset Management Ltd (−33%, 91% in the basket), Trivest Advisors Ltd (−32%, 88% in the basket), Central Asset Investments & Management Holdings (HK) Ltd (−30%, 98% in the basket). Every fund on the list had at least a quarter of its book in semiconductors, hardware or communication equipment. Section 7 has the full table.
- Which hedge funds avoided the 2026 AI selloff?
- The top-rated books that held up best to July 29, 2026 had almost nothing in the basket: Gqg Partners LLC (+7%), Pale Fire Capital Se (+7%), Ruffer LLP (+6%), Miller Value Partners LLC (+5%), Keenan Capital LLC (+5%), Brick & Kyle, Associates (+5%). They are value, emerging-market, bank and small-cap books. The funds whose Q2 trading helped most, measured as the June 30 book's drawdown minus the March 31 book's, were Madison Avenue Partners LP (+21.0 pts), Ardmore Road Asset Management LP (+16.2 pts), Westerly Capital Management LLC (+14.4 pts), in each case by selling memory, optical or semiconductor names during the quarter.
- How much of hedge fund portfolios is in AI and semiconductor stocks?
- A lot more at the best funds than at the worst. At June 30, 2026 the median four- or five-star fund had 16.2% of its disclosed book in semiconductors, computer hardware and communication equipment (mean 18.7%); 64% of those funds had 10% or more and 41% had 20% or more. The median bottom-rated fund had 4.9%. Across all top-rated funds' top-50 positions the basket was 26.3% of dollars, up from 19.5% at March 31, and the increase came from prices rising, not from buying.
This study describes disclosed positions and their past returns. It is not a recommendation to buy or sell any security, and past returns of a disclosed book are not a forecast of a fund's future returns.
More in this series
- Only 21% of active 13F funds beat the S&P 500 over five yearsOriginal Research · September 24, 2026
- Does a top 13F track record persist? About a third of it doesOriginal Research · September 24, 2026
- Q2 2026: where the top-rated 13F funds are overweight, and where they are notOriginal Research · September 24, 2026
- What the best 13F funds are losing on, and what they are up eightfold onOriginal Research · September 24, 2026
- How StockDrifts rates 13F funds: the star rating, the universe and the limits of the dataMethodology · September 24, 2026