 StockDrifts
Does a top 13F track record persist? About a third of it does
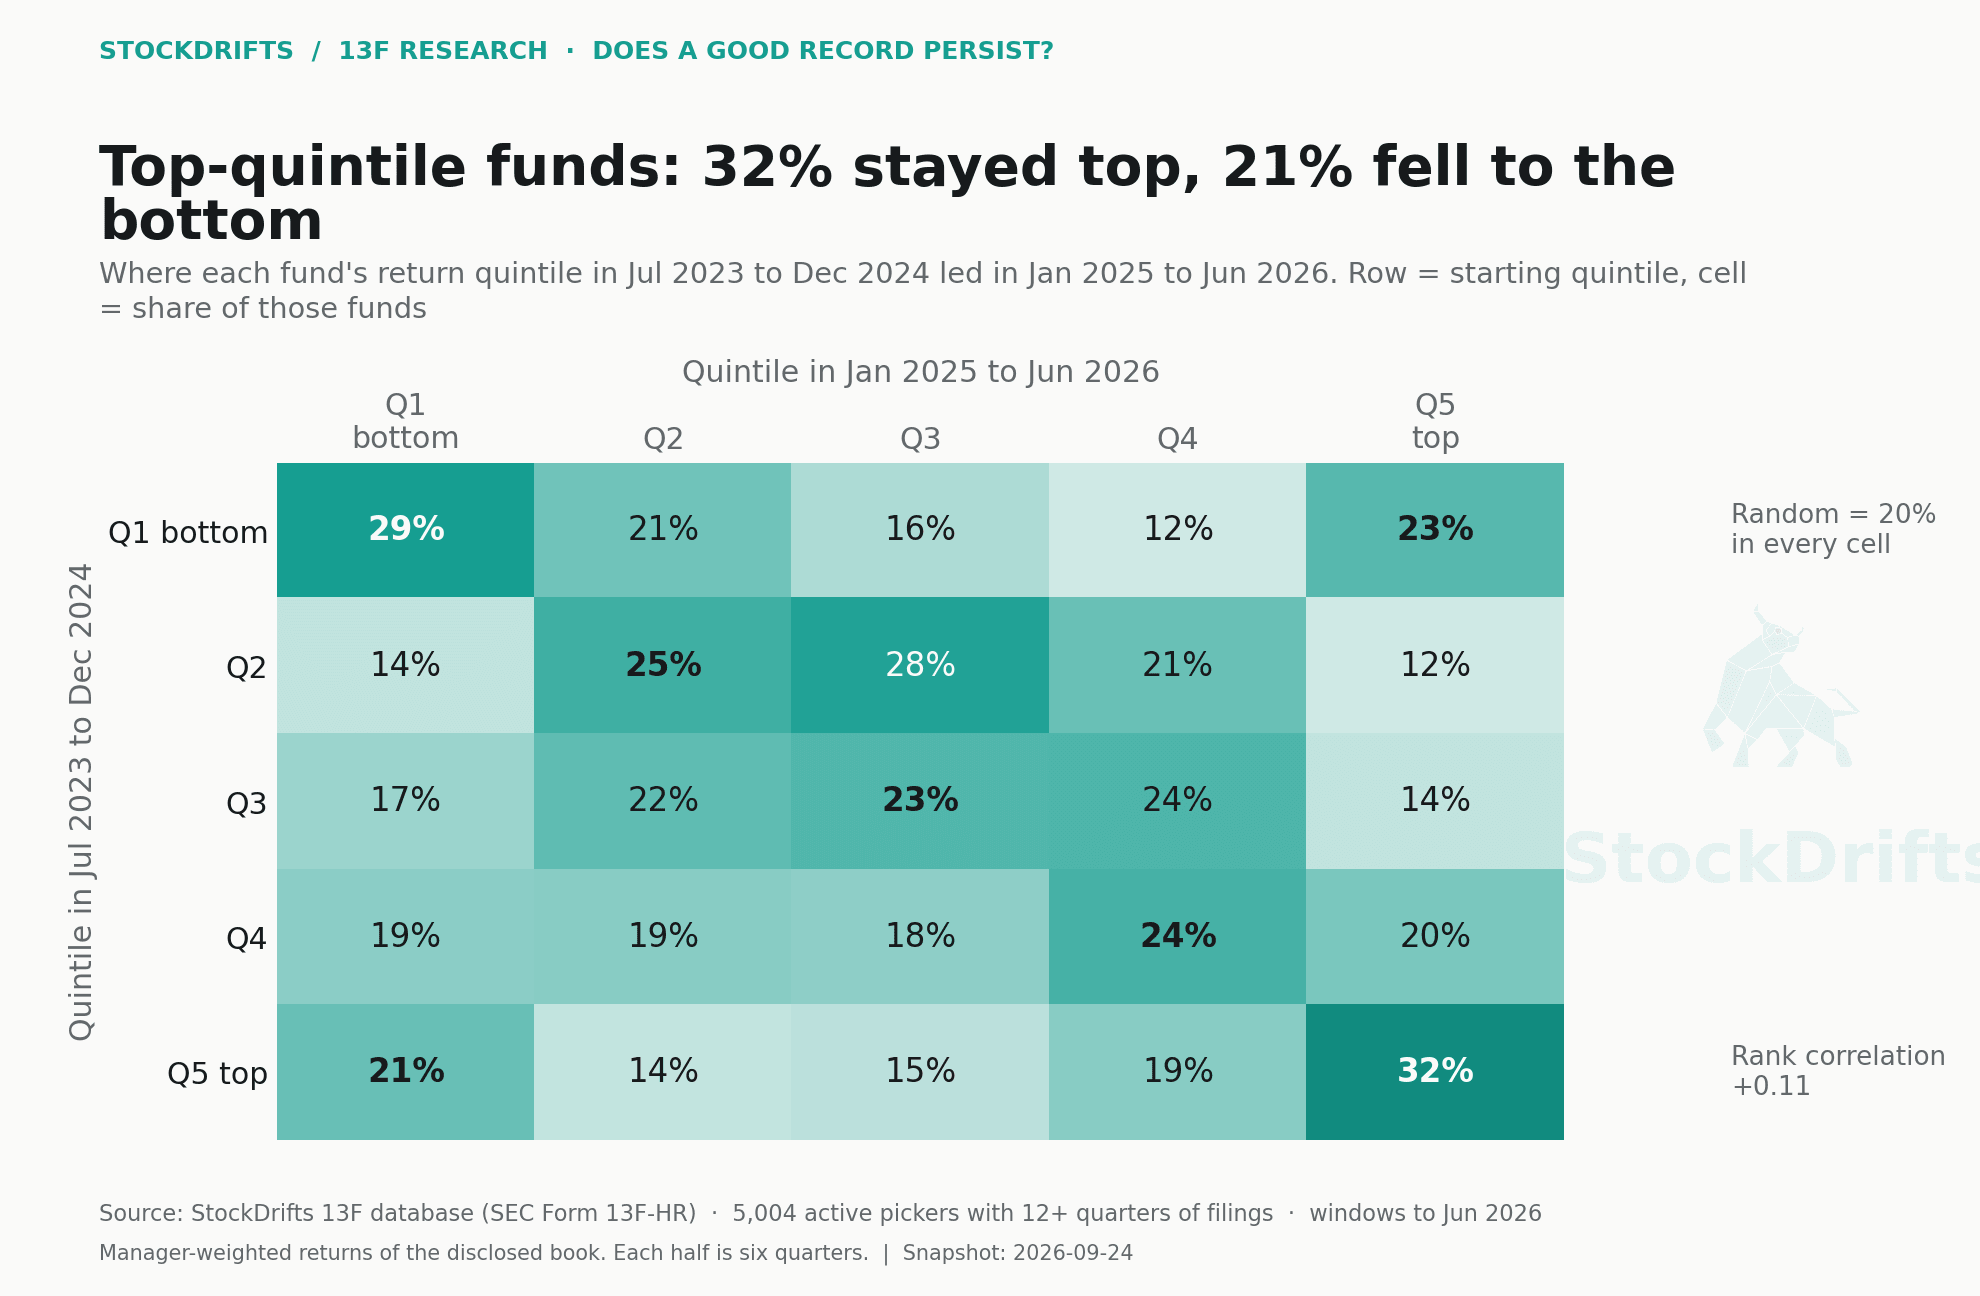
We split 5,004 active funds' disclosed-book returns into two 18-month halves and asked whether the first half predicted the second. Top-quintile funds stayed top 32% of the time and fell to the bottom 21% of the time. Prior winners beat the index next period more often than prior losers, and as a group still trailed it.
Top-quintile funds that stayed top quintile
32%
Random would be 20%
Top-quintile funds that fell to the bottom quintile
21%
Random would be 20%
Beat the index next period: prior beaters vs laggards
43% vs 29%
All funds 34%
Rank correlation, half to half
+0.11
Zero = no persistence, one = perfect
The reading in 30 seconds
- Persistence exists and it is weak. The rank correlation between a fund's first-half and second-half return is +0.11. Top-quintile funds repeated 32% of the time against a random 20%, and 21% of them fell all the way to the bottom quintile.
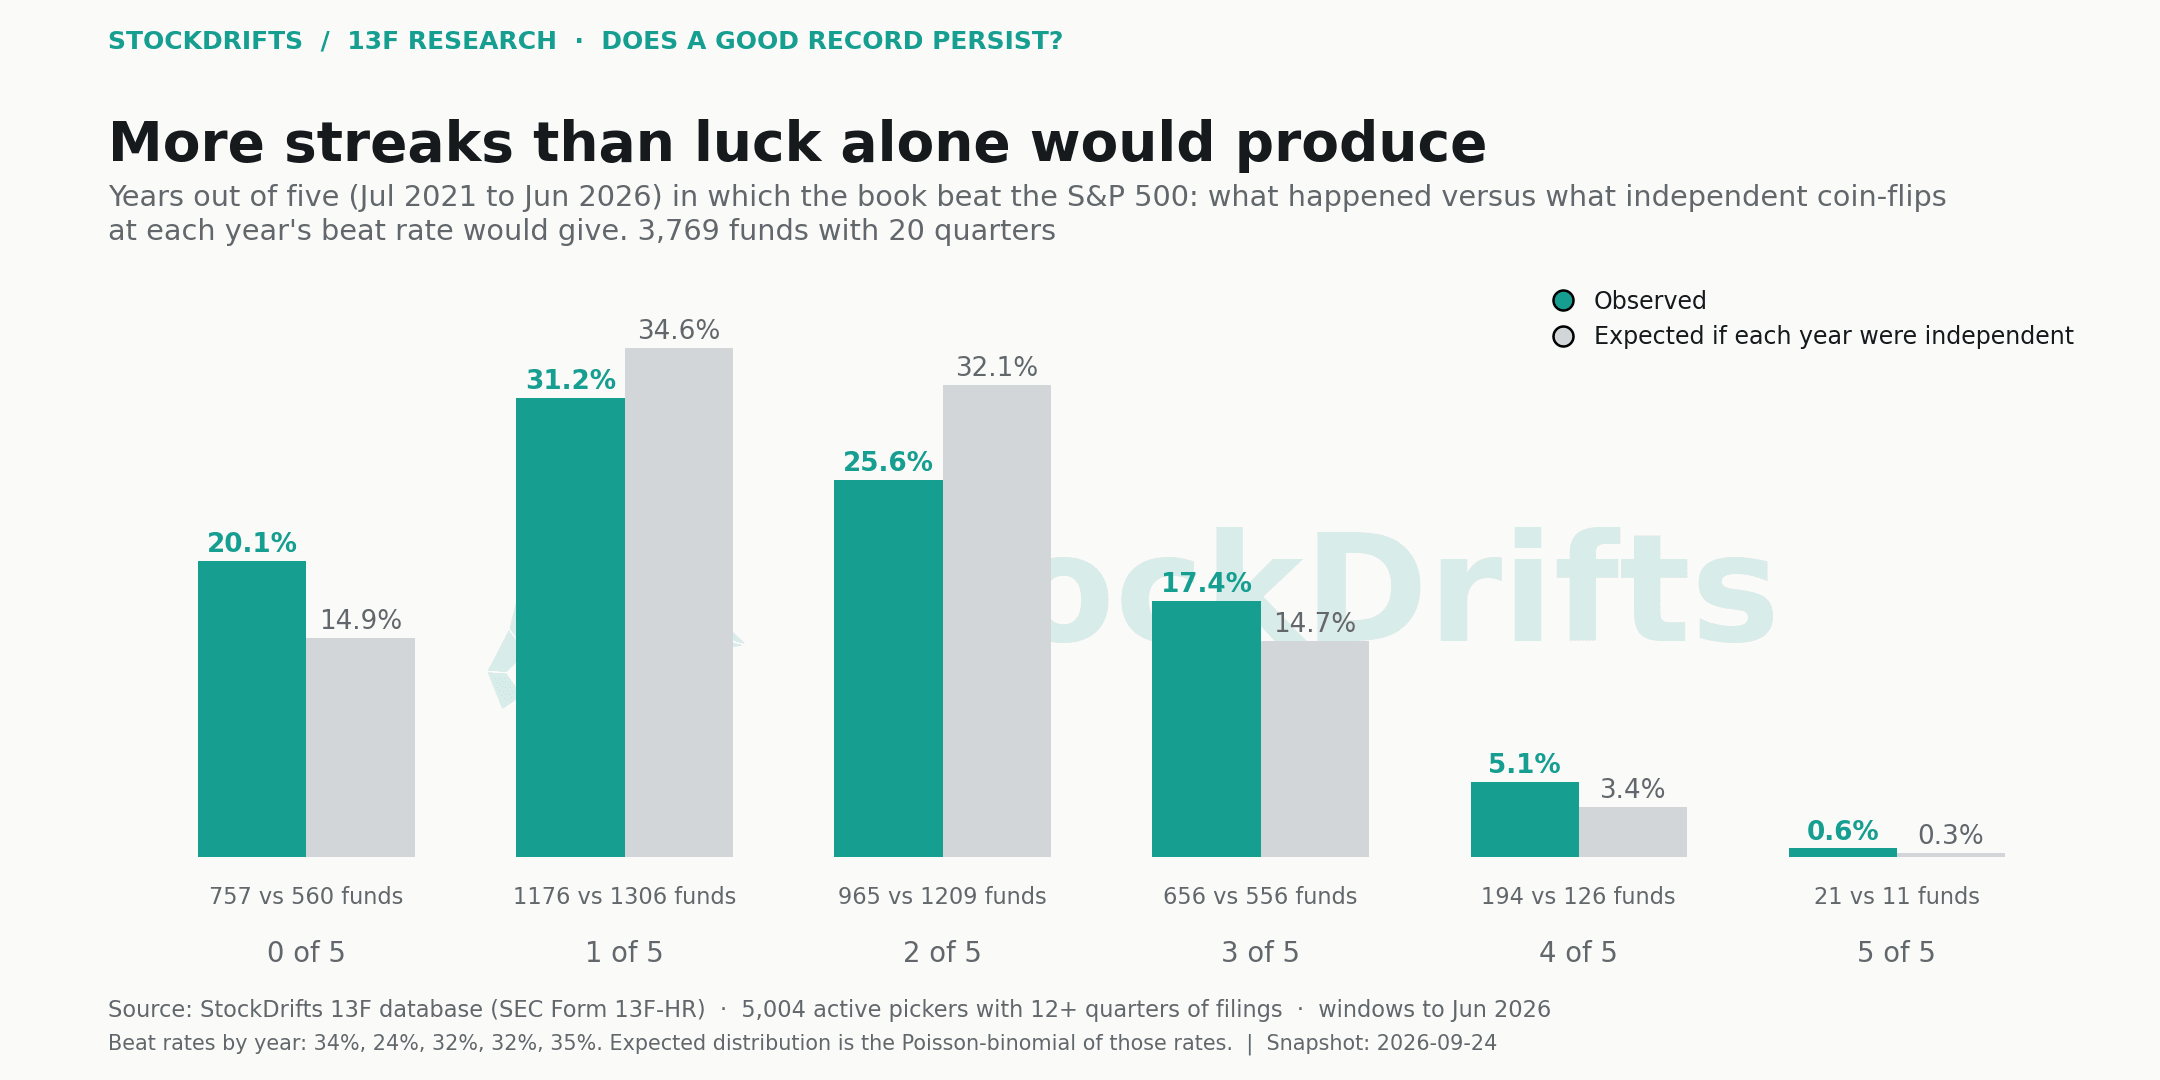
- Beating the index is stickier than ranking. Funds that beat the S&P 500 in the first half beat it in the second 43% of the time; funds that trailed it did so 29% of the time. Over five years, 21 funds beat the index in every year against 11 expected by chance, and 194 did it in four of five against 127.
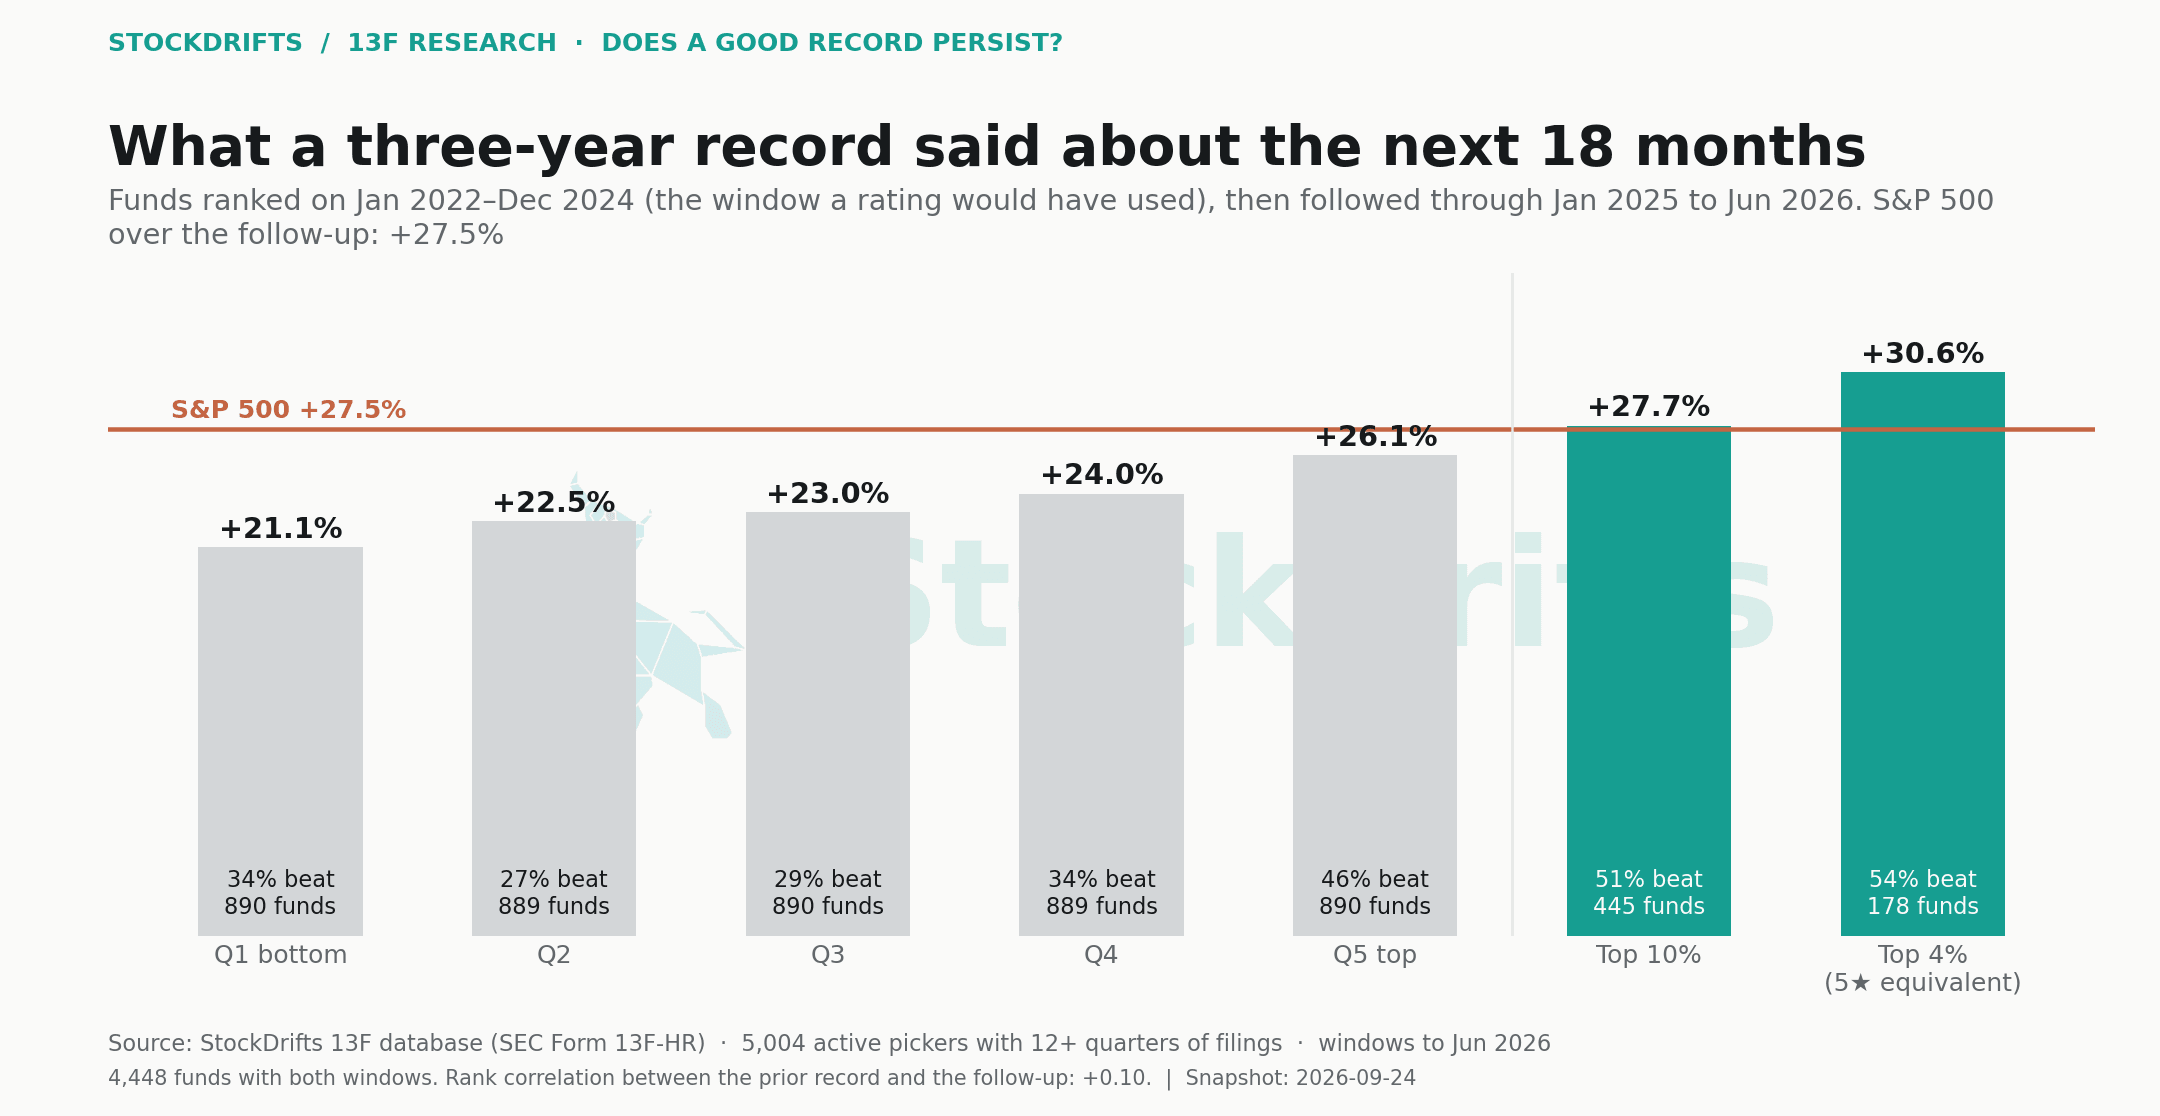
- A rating would have helped, a little. Funds in the top 4% of the three-year record to December 2024, the five-star equivalent, beat the index over the next 18 months 54% of the time with a median return of +30.6%, against 34% and +23.0% for the middle quintile. Every quintile below the top decile trailed the index's +27.5%.
01 / Two halves
Do the best performing funds stay on top? Where the first-half quintiles went
Rank 5,004 funds by the return of their disclosed book from July 2023 to December 2024, cut them into fifths, and follow each fifth through January 2025 to June 2026. If records carried no information, every cell of the transition matrix would read 20%. The top quintile's row reads 32% stayed top, 21% fell to the bottom, with the three middle quintiles sharing the rest. The bottom quintile's row is its mirror: 29% stayed bottom, 23% jumped to the top.
That U-shape at the corners is the main feature of the data. The funds at either end of the first half are disproportionately the funds at either end of the second half, in both directions. What persists most reliably is not the sign of a fund's outperformance but the size of its swings: concentrated, high-variance books stay high-variance.
Run the same test on equal-weighted books, which isolates stock picking from position sizing, and the correlation rises slightly to +0.13, with 34% of top-quintile pickers staying top. Picking persists a little more than sizing does.
02 / What the prior quintile earned next
Past winners beat past losers, and both trailed the index
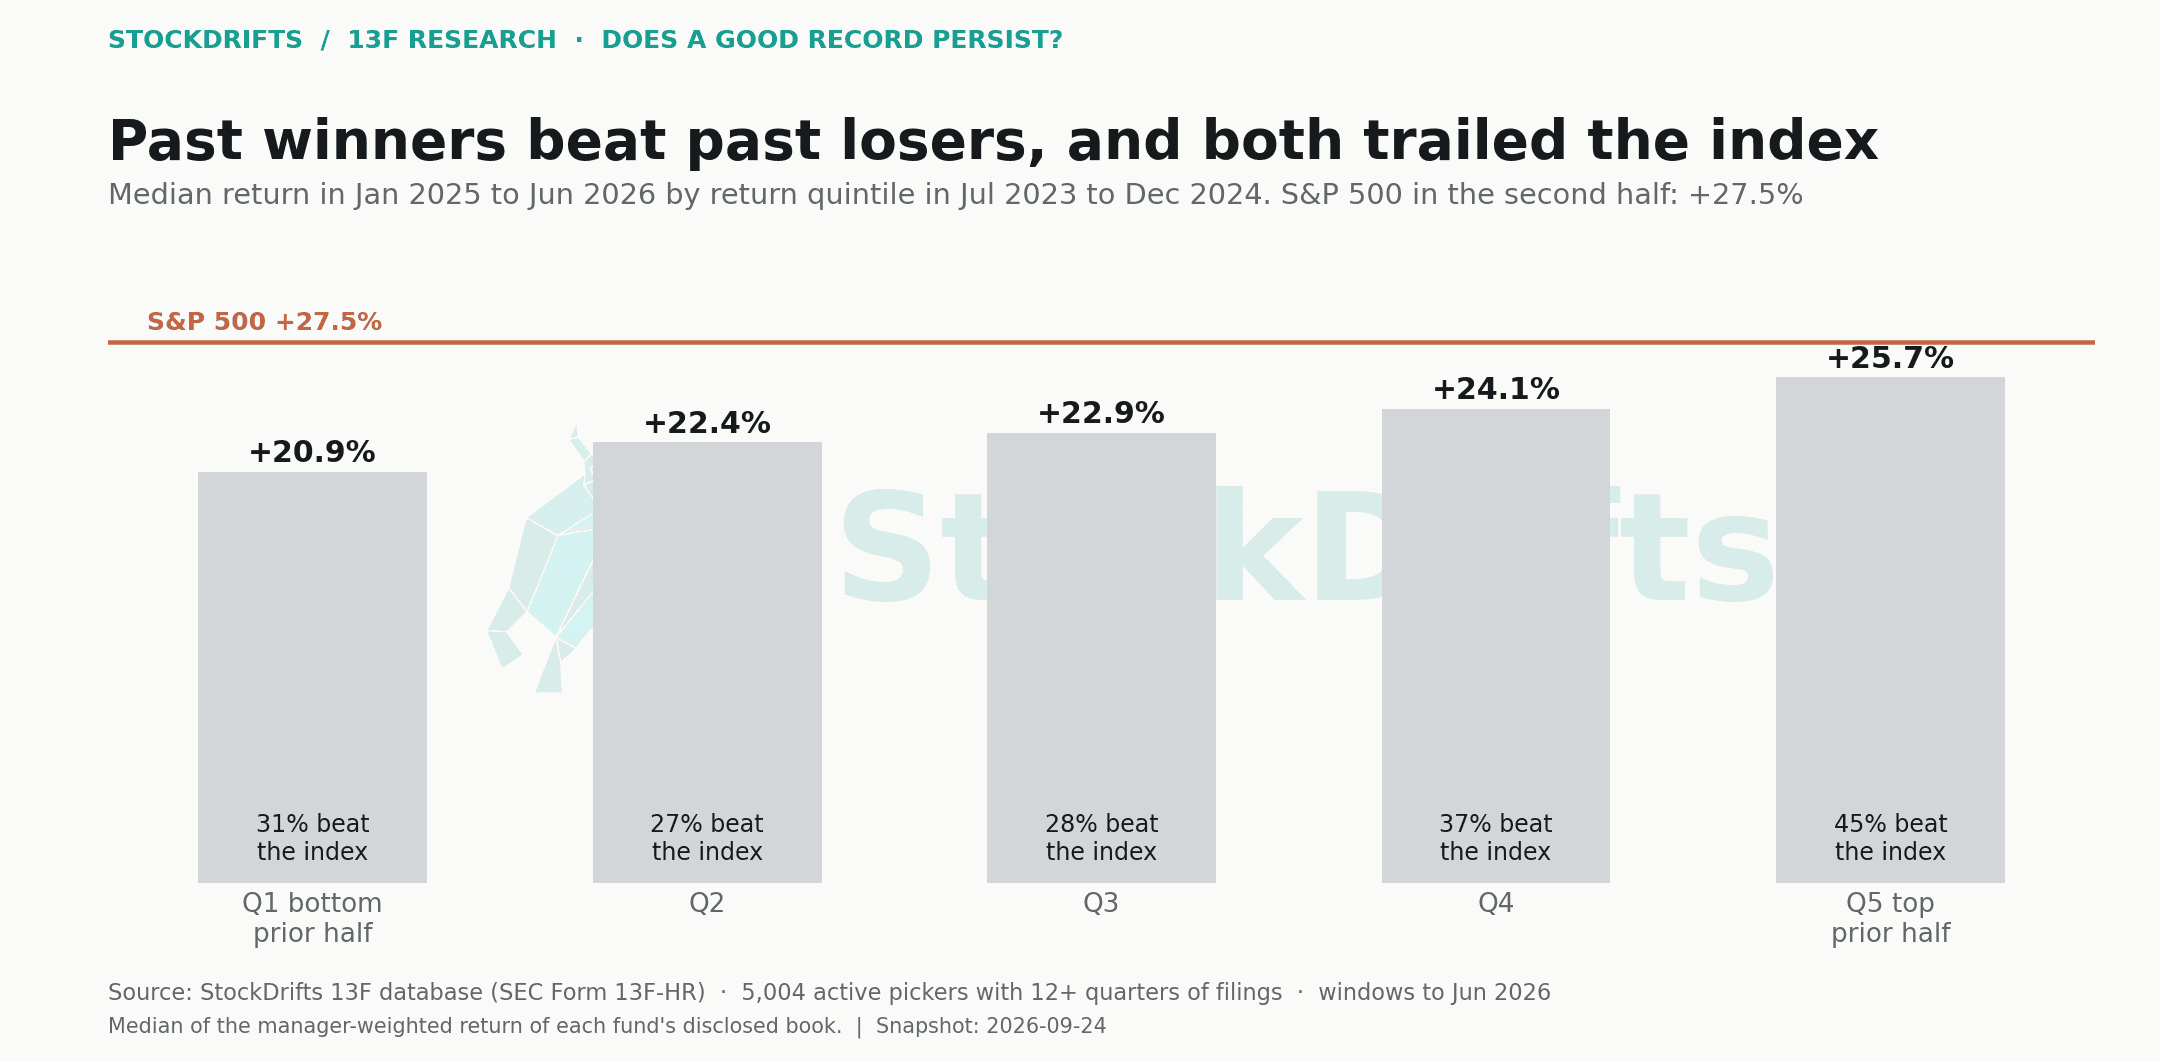
The median second-half return rises with the first-half quintile, from +20.9% for the bottom fifth to +25.7% for the top fifth, and the share beating the index rises from 31% to 45%. So the record ranked the funds in the right order. It did not rank them above the index: the S&P 500 returned +27.5% in the second half, and the median fund in every prior quintile, including the top one, came in below it.
Averages tell a slightly different story. The top quintile's mean second-half return was +33.4%, against a median of +25.7%: a minority of repeat winners with very large second-half returns pulls the mean above the index while the typical repeat fund sits below it.
03 / Beaters and laggards
Prior-period winners beat the index next period about 44% of the time
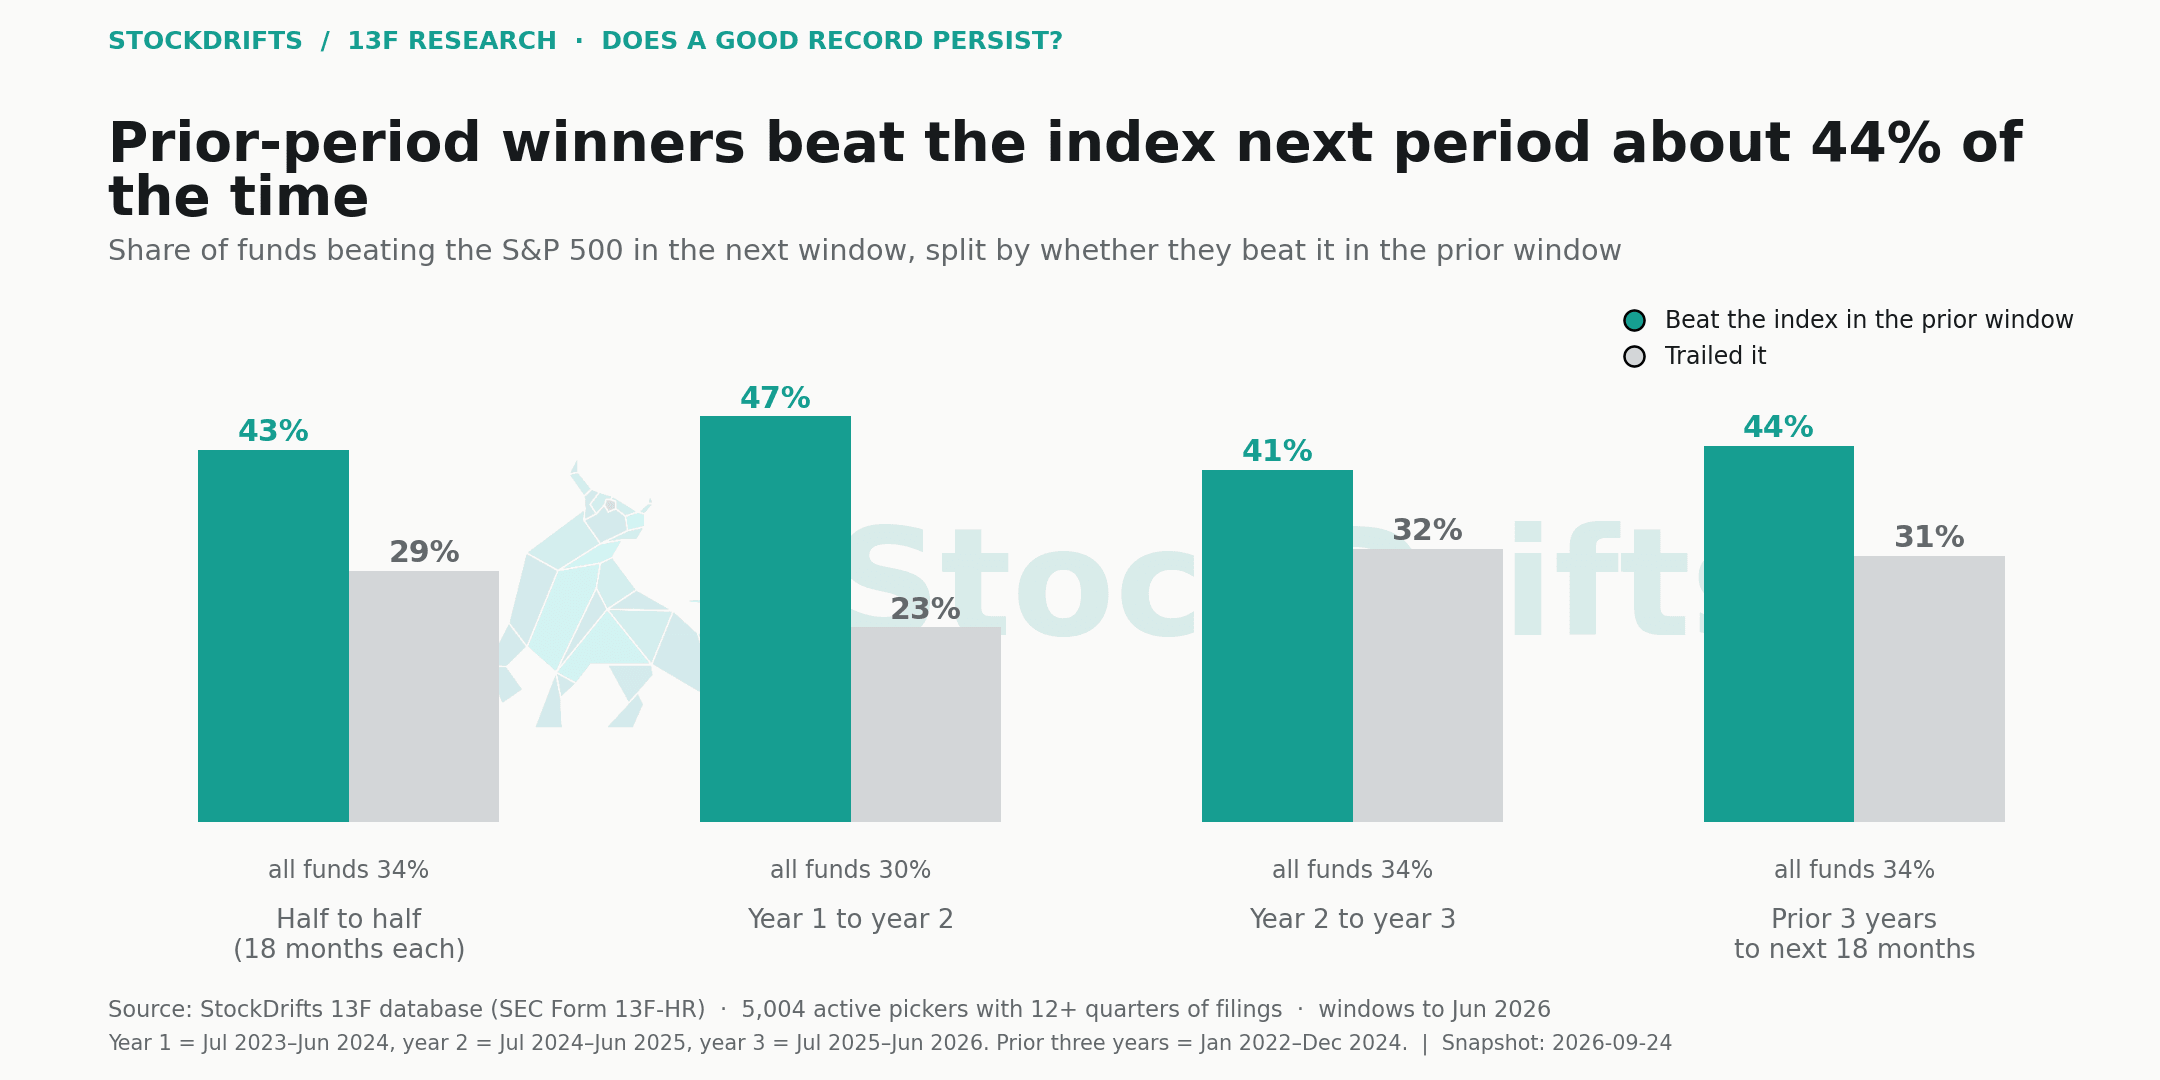
Replace quintiles with a simpler test: did the fund beat the S&P 500 in the prior window, and did it beat it in the next? Half to half, 43% of prior beaters beat the index again and 29% of prior laggards did, against 34% of all funds. Year to year the gap is the same shape: 47% against 23% from the first year to the second, 41% against 32% from the second to the third. Ranking funds on a full three-year record to December 2024 gives 44% against 31% over the following 18 months.
The gap is consistent and it is about 14 points. A prior beater is roughly one and a half times as likely to beat the index next period as a prior laggard, and less likely than not to do it.
04 / Year to year
The extremes stick, the middle shuffles
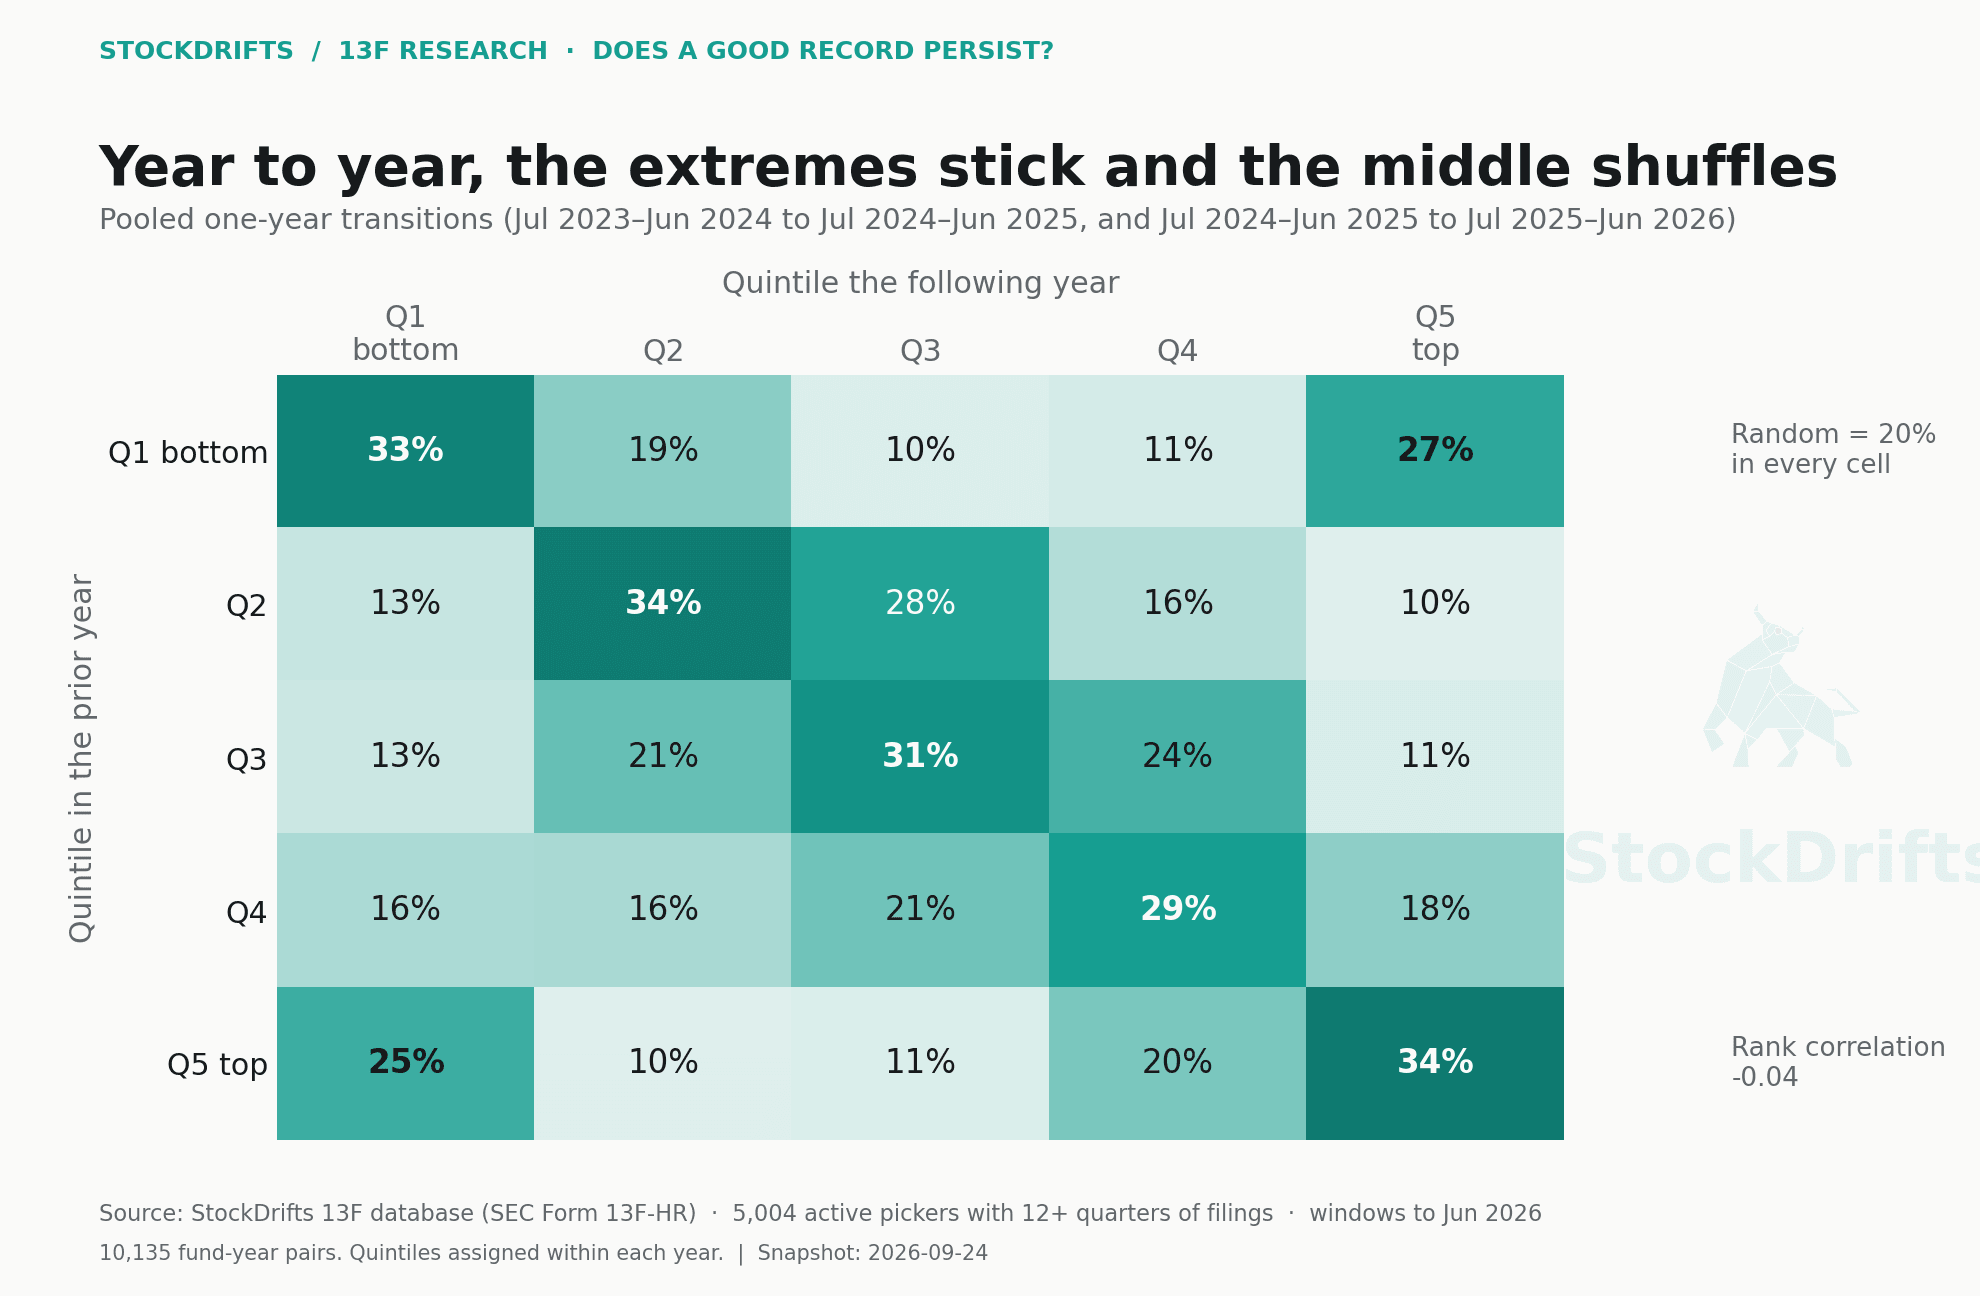
Pool the two consecutive one-year transitions (10,135 fund-years) and the rank correlation is -0.04: nothing, on the face of it. But the corners of the matrix are as far from 20% as they are in the half-to-half version. Top-quintile years were followed by another top-quintile year 34% of the time and by a bottom-quintile year 25% of the time; bottom-quintile years were followed by another bottom year 33% of the time and by a top year 27%.
A near-zero correlation with strong corners means the same thing as before. Ranks do not persist in a straight line; what persists is membership of the extremes. Over one-year windows, the funds that produce top-quintile years are largely the funds that also produce bottom-quintile years.
05 / Streaks
More streaks than chance would produce
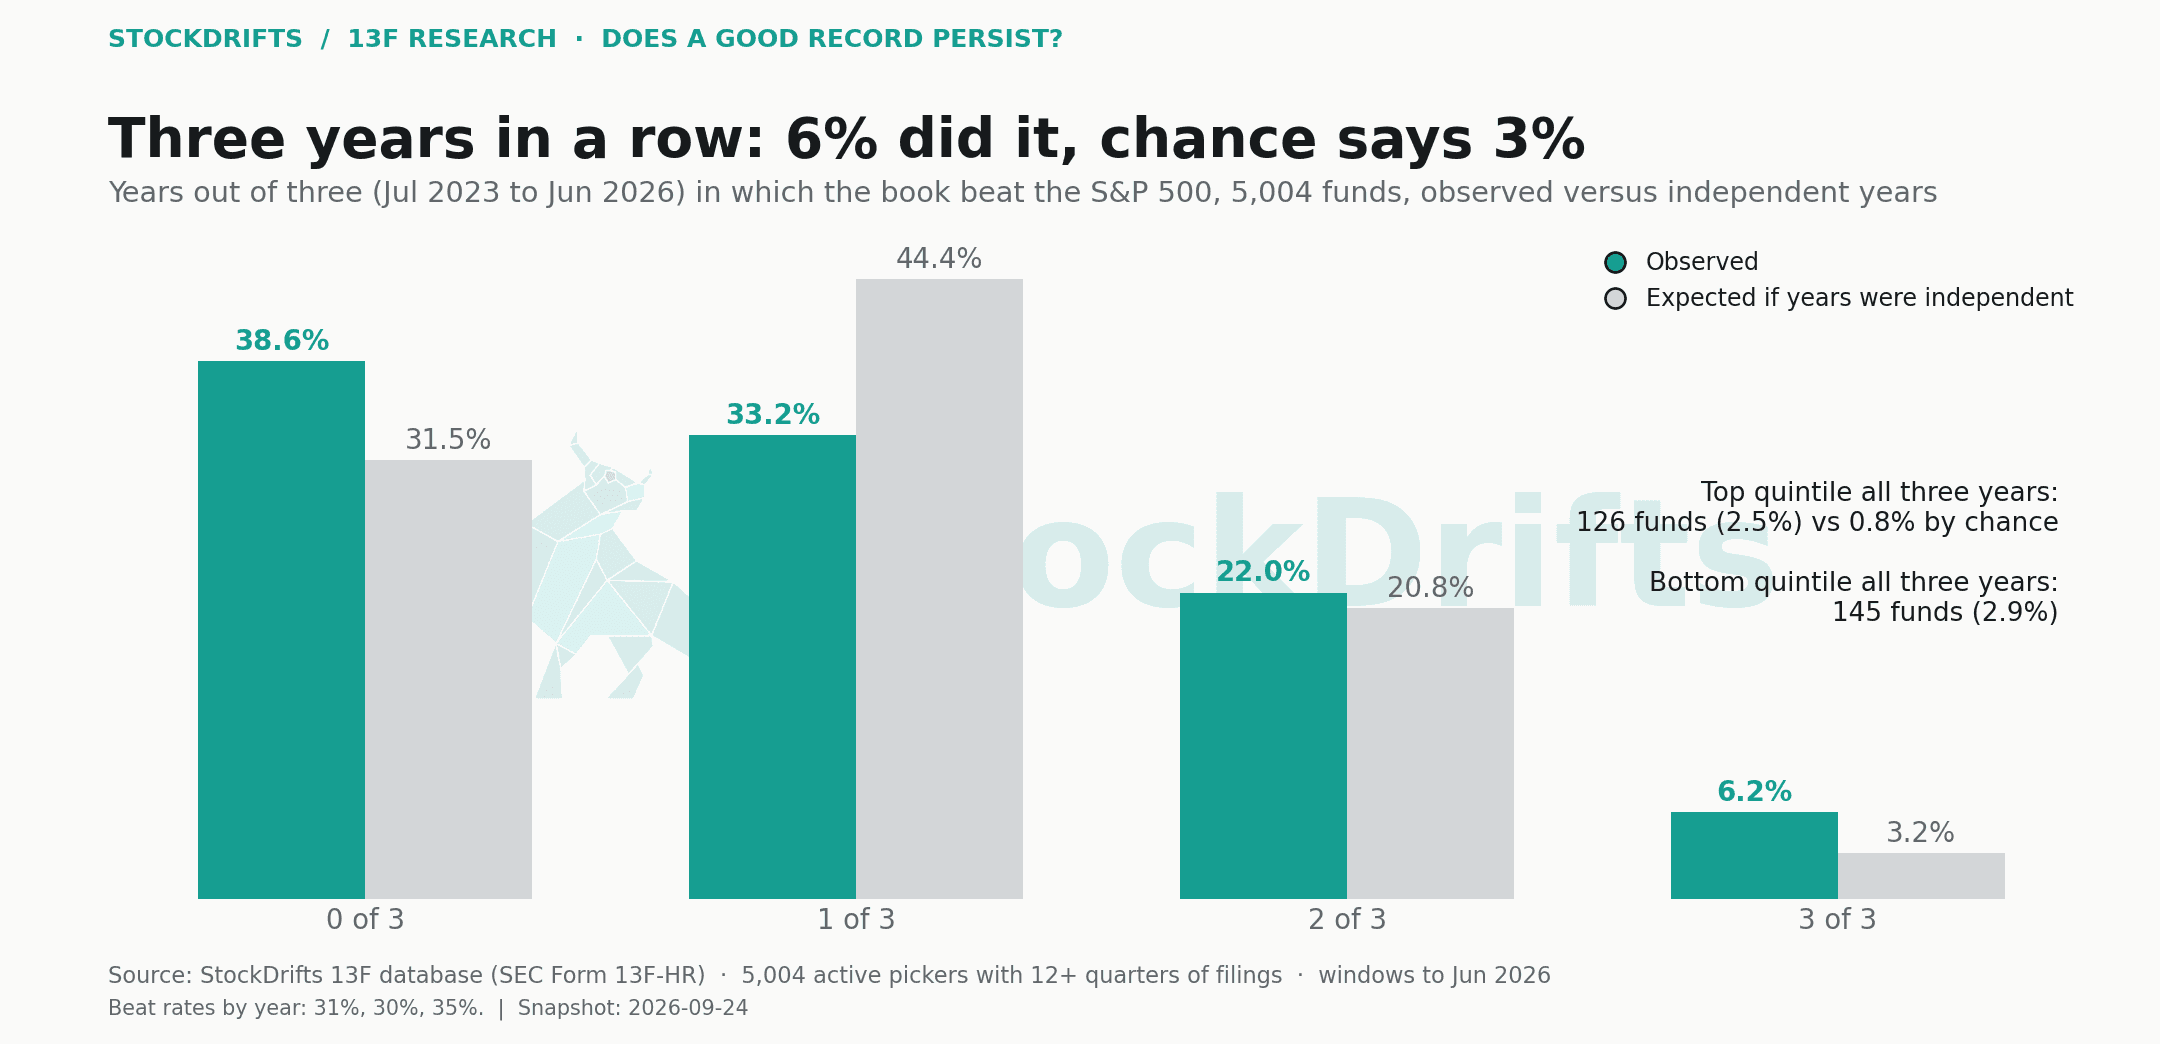
If each year's result were an independent draw at that year's beat rate (31%, 30%, 35%), 3.2% of funds would beat the index in all three years. 6.2% did, 311 funds. Being in the top quintile in all three years would happen 0.8% of the time by chance; 126 funds (2.5%) did it. Being in the bottom quintile in all three years: 145 funds (2.9%).
The five-year version, for the 3,769 funds with twenty quarters of history, is the cleaner test because the window includes the 2022 bear market. 21 funds beat the index in all five years against 11 expected; 194 did it in four of five against 127. And at the other end, 757 funds beat it in none of the five years against 560 expected. Both tails are fatter than independence allows. Skill and its absence both show up in the streaks, and the absence shows up more.
06 / What a three-year record predicted
The rating test
StockDrifts' star rating is a percentile of a three-year record. To test what such a rating would have told an investor, rank the 4,448 funds with enough history on their three-year return to December 2024, the window a rating computed then would have used, and follow them through June 2026. The top quintile of that prior record beat the index over the next 18 months 46% of the time, the bottom quintile 34%, all funds 34%. Narrow it to the top 10% and the beat rate is 51% with a median return of +27.7%; narrow it to the top 4%, the five-star equivalent, and it is 54% with a median of +30.6%, against the index's +27.5%.
So a five-star record was worth something: a better-than-even chance of beating the index over the following 18 months, in a period when two thirds of funds did not. It was not worth a lot. The rank correlation between the prior record and the follow-up is +0.10, and only the top decile of the prior ranking beat the index at the median.
07 / The persistent
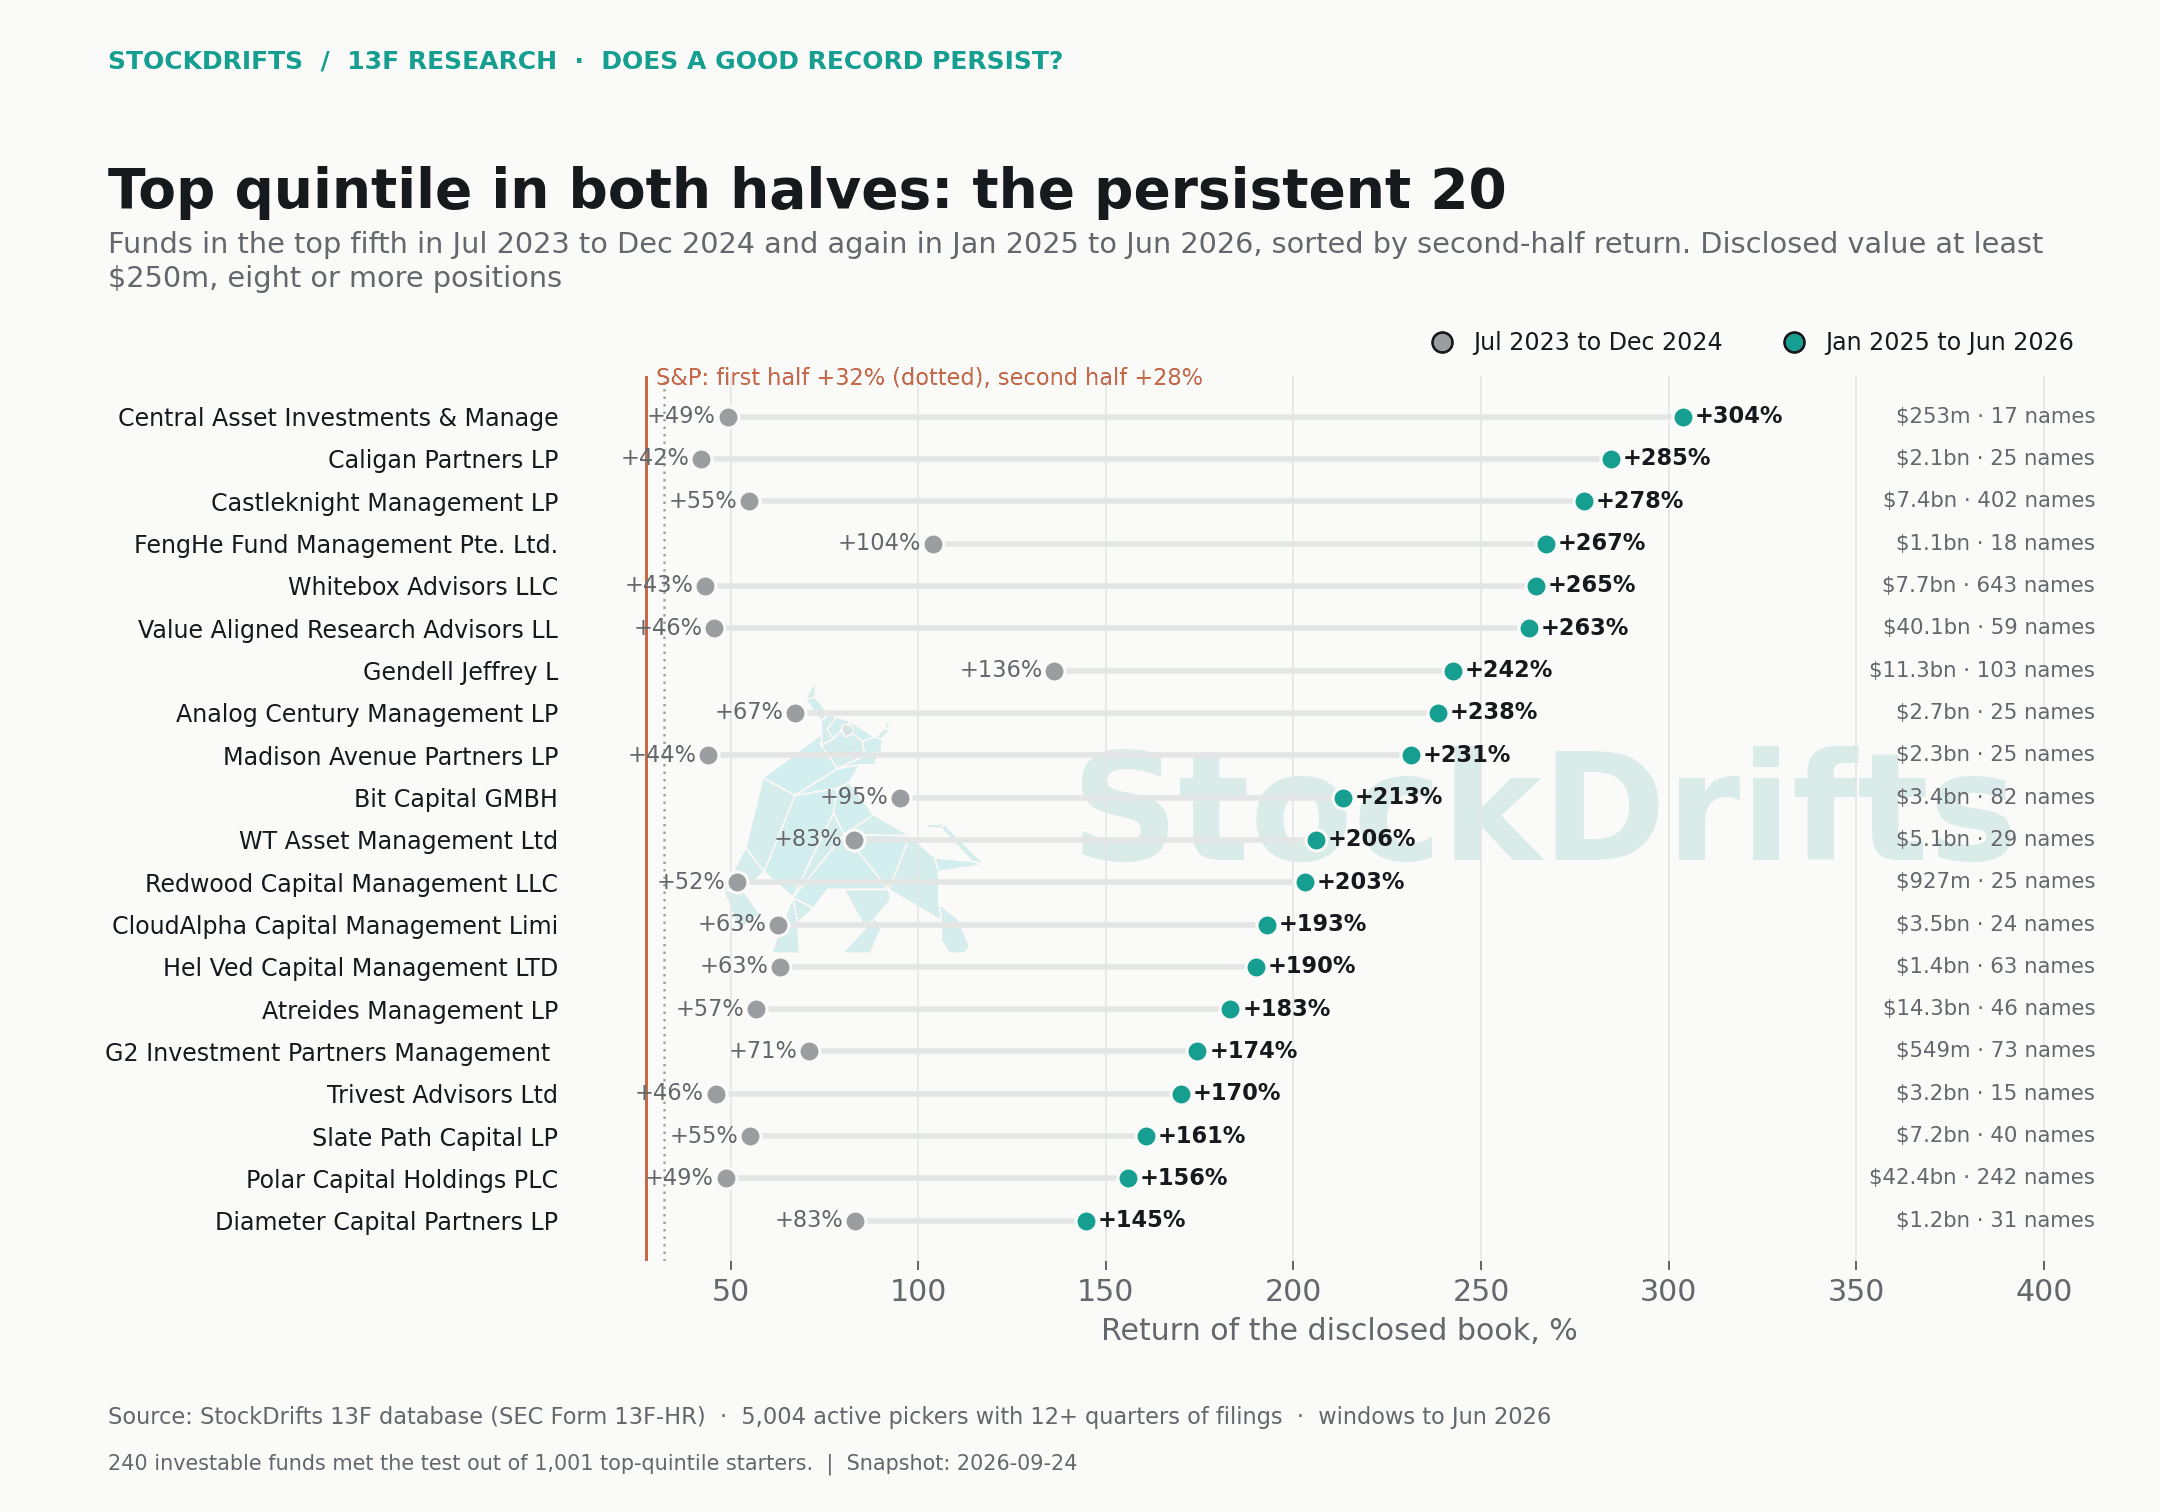
Top quintile in both halves
240 funds with at least $250m disclosed and eight or more positions were in the top quintile in both halves, out of 1,001 top-quintile starters. The twenty-five with the strongest second half are below, each linked to its StockDrifts page. Several are Asia-based managers of US technology supply-chain books (FengHe, WT Asset Management, CloudAlpha, Hel Ved); several are semiconductor specialists (Analog Century, Atreides); and two are large multi-strategy books whose disclosed longs happened to run (Whitebox, Castleknight).
Three years in a row is the stricter test. 95 investable funds were in the top quintile in each of the three years to June 2026; the thirty with the strongest third year are in the second table.
08 / The reversals
Top quintile, then bottom quintile
117 investable funds went from the top fifth in the first half to the bottom fifth in the second. The largest are household names: Baillie Gifford ($110bn disclosed, +50% then +3%), Loomis Sayles, GQG Partners (+81% then +6%), Horizon Kinetics (+121% then +12%). The reverse move, bottom fifth to top fifth, was made by 142 investable funds.
Two cautions on reading the names. These are returns of the disclosed US long book, not fund returns; a global or hedged manager's 13F is a slice of its portfolio. And a large fund whose book returned +3% in eighteen months when the index returned +28% has had a poor stretch by this measure, not a disaster. The point of the list is that the first-half leaders included some of the largest, longest-established growth managers in the database, and the second half reversed them.
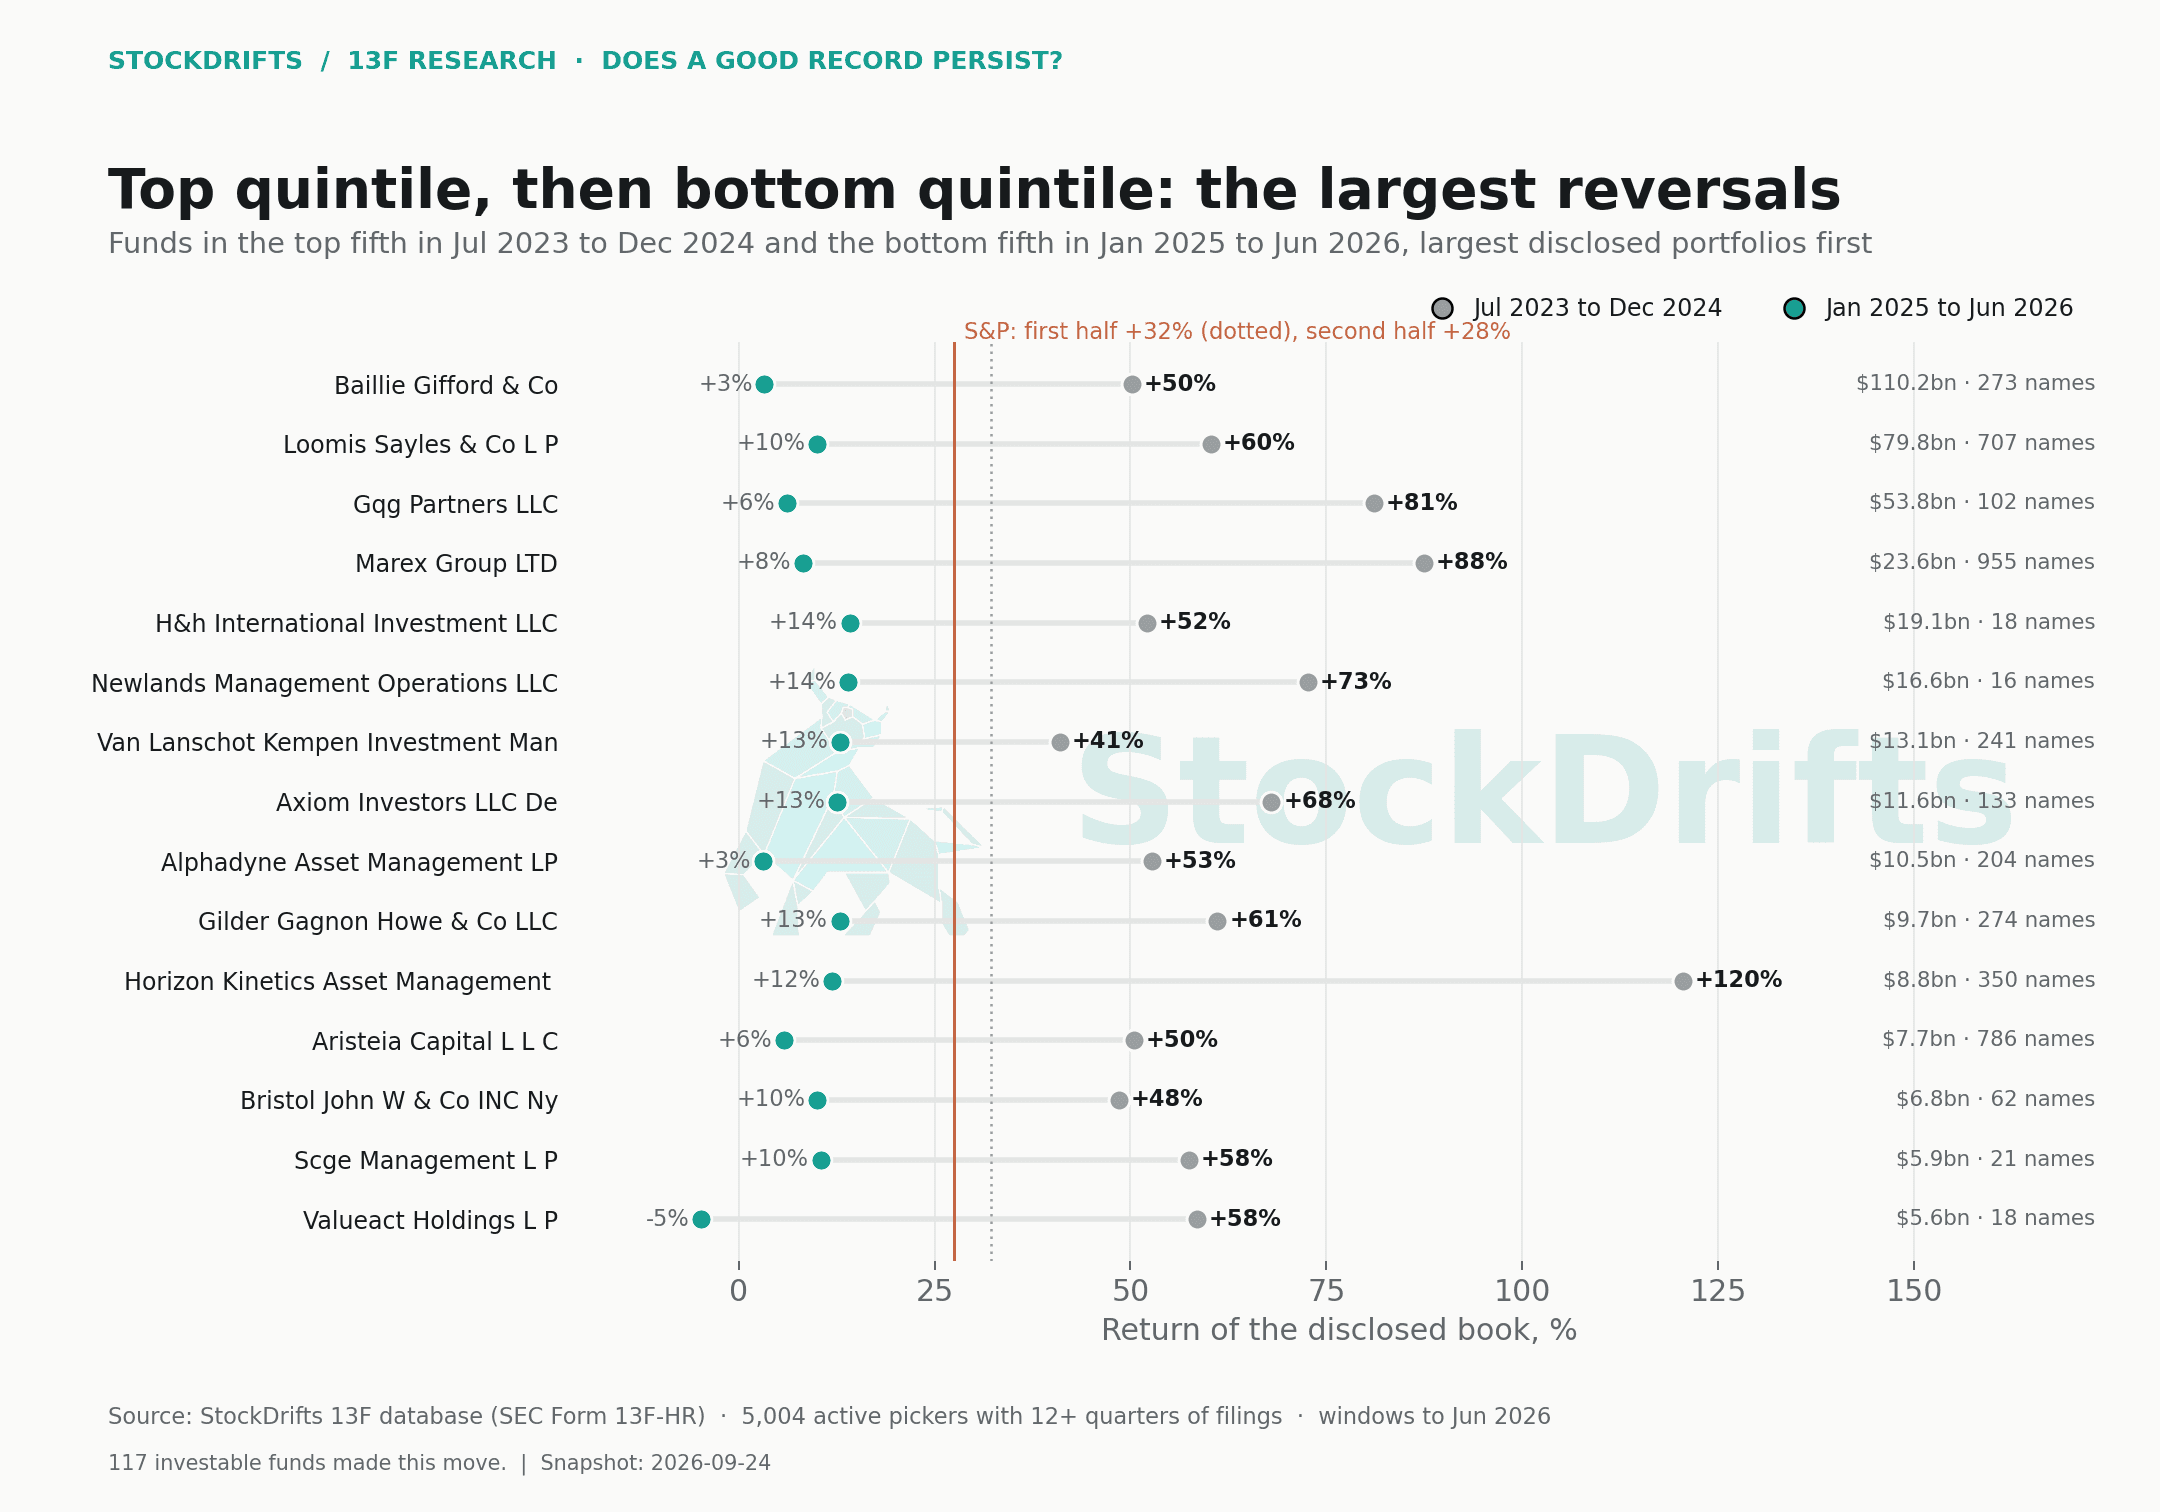
| Fund | Disclosed | Positions | Jul 2023 to Dec 2024 | Jan 2025 to Jun 2026 |
|---|---|---|---|---|
| Baillie Gifford & CO | $110.2bn | 273 | +50% | +3% |
| Loomis Sayles & CO L P | $79.8bn | 707 | +60% | +10% |
| Gqg Partners LLC | $53.8bn | 102 | +81% | +6% |
| Marex Group LTD | $23.6bn | 955 | +88% | +8% |
| H&h International Investment LLC | $19.1bn | 18 | +52% | +14% |
| Newlands Management Operations LLC | $16.6bn | 16 | +73% | +14% |
| Van Lanschot Kempen Investment Management N V | $13.1bn | 241 | +41% | +13% |
| Axiom Investors LLC De | $11.6bn | 133 | +68% | +13% |
| Alphadyne Asset Management LP | $10.5bn | 204 | +53% | +3% |
| Gilder Gagnon Howe & CO LLC | $9.7bn | 274 | +61% | +13% |
| Horizon Kinetics Asset Management LLC | $8.8bn | 350 | +121% | +12% |
| Aristeia Capital L L C | $7.7bn | 786 | +51% | +6% |
| Bristol John W & CO INC Ny | $6.8bn | 62 | +49% | +10% |
| Scge Management L P | $5.9bn | 21 | +58% | +11% |
| Valueact Holdings L P | $5.6bn | 18 | +59% | −5% |
09 / Explore the evidence
Every fund, both halves
Search all 5,004 funds. Quintile 5 is the top fifth of the 5,004 in that half, quintile 1 the bottom fifth. The three yearly columns are the three consecutive years to June 30, 2026.
Loading the table… · manager-weighted returns of the disclosed book
| Fund | Rating | Disclosed | First half | Quintile | Second half | Quintile | Yr 1 | Yr 2 | Yr 3 |
|---|
Nothing matches these filters.
10 / Methodology & limitations
Exactly what went into this study
The return series. For each fund and quarter, the return of the positions disclosed at the start of the quarter, weighted by disclosed value (manager-weighted) or equally (equal-weighted). Windows chain those quarterly returns. The halves are Q3 2023 to Q4 2024 and Q1 2025 to Q2 2026, six quarters each. The three years are Q3 2023 to Q2 2024, Q3 2024 to Q2 2025 and Q3 2025 to Q2 2026. The five-year test adds Q3 2021 to Q2 2022 and Q3 2022 to Q2 2023 for funds with twenty quarters. The prior-record test uses Q1 2022 to Q4 2024, twelve quarters ending on the December 2024 filing.
Quintiles are assigned within each window among the funds present in both windows of a pair, so every row of a transition matrix has an equal number of funds. Rank correlation is Spearman's: the correlation of the two rankings.
Streaks against chance. The expected share of funds beating the index in k of N years assumes each year is an independent draw at that year's observed beat rate (a Poisson-binomial distribution). For the quintile streaks, the chance of three consecutive top-quintile years under independence is 0.2 cubed, 0.8%.
Who is in. The same universe as the five-year scorecard: Q2 2026 filers with a rating, at least 12 quarters of filings, at most 1,000 positions, and no index, custody, market-making, multi-manager, pension, insurance, sovereign or corporate filers. 5,004 funds have both halves. Named lists additionally require $250m disclosed and eight or more positions and exclude venture, charitable, endowment and pension filers.
Survivorship. Every fund here was still filing at June 30, 2026. Funds that stopped filing during the window, which includes funds that closed after a poor stretch, are absent. That makes persistence at the bottom look weaker than it was, and the count of long streaks look slightly better.
What 13F cannot show. Long positions in US-listed securities only; no shorts, cash, non-US listings or derivatives; each fund's top 50 positions in this database. A fund's NAV can persist or reverse for reasons invisible here.
Sources. StockDrifts 13F database (SEC Form 13F-HR, all filers), snapshot September 24, 2026, filings through September 11, 2026. Scripts, intermediate tables and the summary file are published alongside this article.
11 / Questions
Questions this study answers
- Do the best performing hedge funds stay on top?
- About a third of the time. Of 5,004 funds ranked on their first-half return, 32% of the top fifth were still in the top fifth in the second half and 21% had fallen to the bottom fifth; chance would put 20% in each. The rank correlation between halves was +0.11.
- Can you make money copying hedge fund 13F filings?
- The data says a good record raises the odds and does not make them good. Prior-window beaters beat the index next window 43% of the time against 29% for prior laggards; funds in the top 4% of a three-year record beat it over the next 18 months 54% of the time with a median +30.6% against the index's +27.5%. 13F positions are published up to 45 days after quarter end, so a copier trades at different prices. This is a description of the data, not advice.
- How many hedge funds beat the S&P 500 five years in a row?
- 21 of 3,769 funds beat the S&P 500 in each of the five years to June 30, 2026, against 11 expected by chance; 194 did it in four of five against 127 expected. At the other end, 757 beat it in none of the five years against 560 expected.
- Does past hedge fund performance predict future returns?
- Weakly. Ranking 4,448 funds on their three-year record to December 2024 and following them for 18 months gives a rank correlation of +0.10. The top fifth of the prior record beat the index next 46% of the time, the bottom fifth 34%, all funds 34%. Only the top decile of the prior ranking beat the index at the median.
- Which hedge funds have been in the top quintile three years running?
- 95 investable funds were in the top fifth in each of the three years to June 30, 2026, including FengHe Fund Management Pte. Ltd., Analog Century Management LP, Castleknight Management LP, Hel Ved Capital Management LTD, WT Asset Management Ltd, Gendell Jeffrey L. The full list is in section 7.
- Which large hedge funds had the biggest reversals?
- Baillie Gifford & CO, Loomis Sayles & CO L P, Gqg Partners LLC, Marex Group LTD, H&h International Investment LLC were all in the top fifth in the first half and the bottom fifth in the second, measured on the return of their disclosed US long book. Section 8 has the list.
This study describes disclosed positions and their past returns. It is not a recommendation to buy or sell any security, and past returns of a disclosed book are not a forecast of a fund's future returns.
More in this series
- Only 21% of active 13F funds beat the S&P 500 over five yearsOriginal Research · September 24, 2026
- Q2 2026: where the top-rated 13F funds are overweight, and where they are notOriginal Research · September 24, 2026
- What the best 13F funds are losing on, and what they are up eightfold onOriginal Research · September 24, 2026
- What the best 13F funds owned before the AI crash, and whether they saw it comingOriginal Research · September 24, 2026
- How StockDrifts rates 13F funds: the star rating, the universe and the limits of the dataMethodology · September 24, 2026