 StockDrifts
Only 21% of active 13F funds beat the S&P 500 over five years
We scored the disclosed US long books of 3,769 active 13F filers against the index over the five years to June 30, 2026, a window that includes the 2022 bear market. Four in five trailed it. Bigger books did better, concentration cost the median fund, and the funds at the top separated on how they sized positions, not only on what they picked.
Beat the S&P 500 over five years
20.8%
3,769 funds with 20 quarters · index +74.5%
Same funds, over three years
30.4%
Index +68.5% · the bear market is what changes
Median fund, five years
+46.1%
Middle half +28% to +69% · 9.4% negative
Beat it over one, three and five years
14.1%
Same fund, all three windows
The reading in 30 seconds
- Over the five years to June 30, 2026, the S&P 500 returned +74.5%. 20.8% of 3,769 active 13F filers beat that with their disclosed long book. The same funds beat the index 30.4% of the time over three years and 35.2% over one; 12.1% of them beat it over three years but not five.
- The bear market did the sorting. In calendar 2022 the index fell 9.3%, the median fund fell 9.9%, and only 6.8% of funds made money. Funds under $100m had a median five-year return of +21% and 34% of them lost money over the five years; funds over $50bn had a median of +75% and none lost money.
- The difference between the top and bottom ratings is partly sizing. Five-star funds' books returned a median +112% equal-weighted and +144% as actually sized over five years; for one-star funds, sizing subtracted 2 points and hurt 58% of them.
01 / The distribution
What percentage of active funds beat the market over five years?
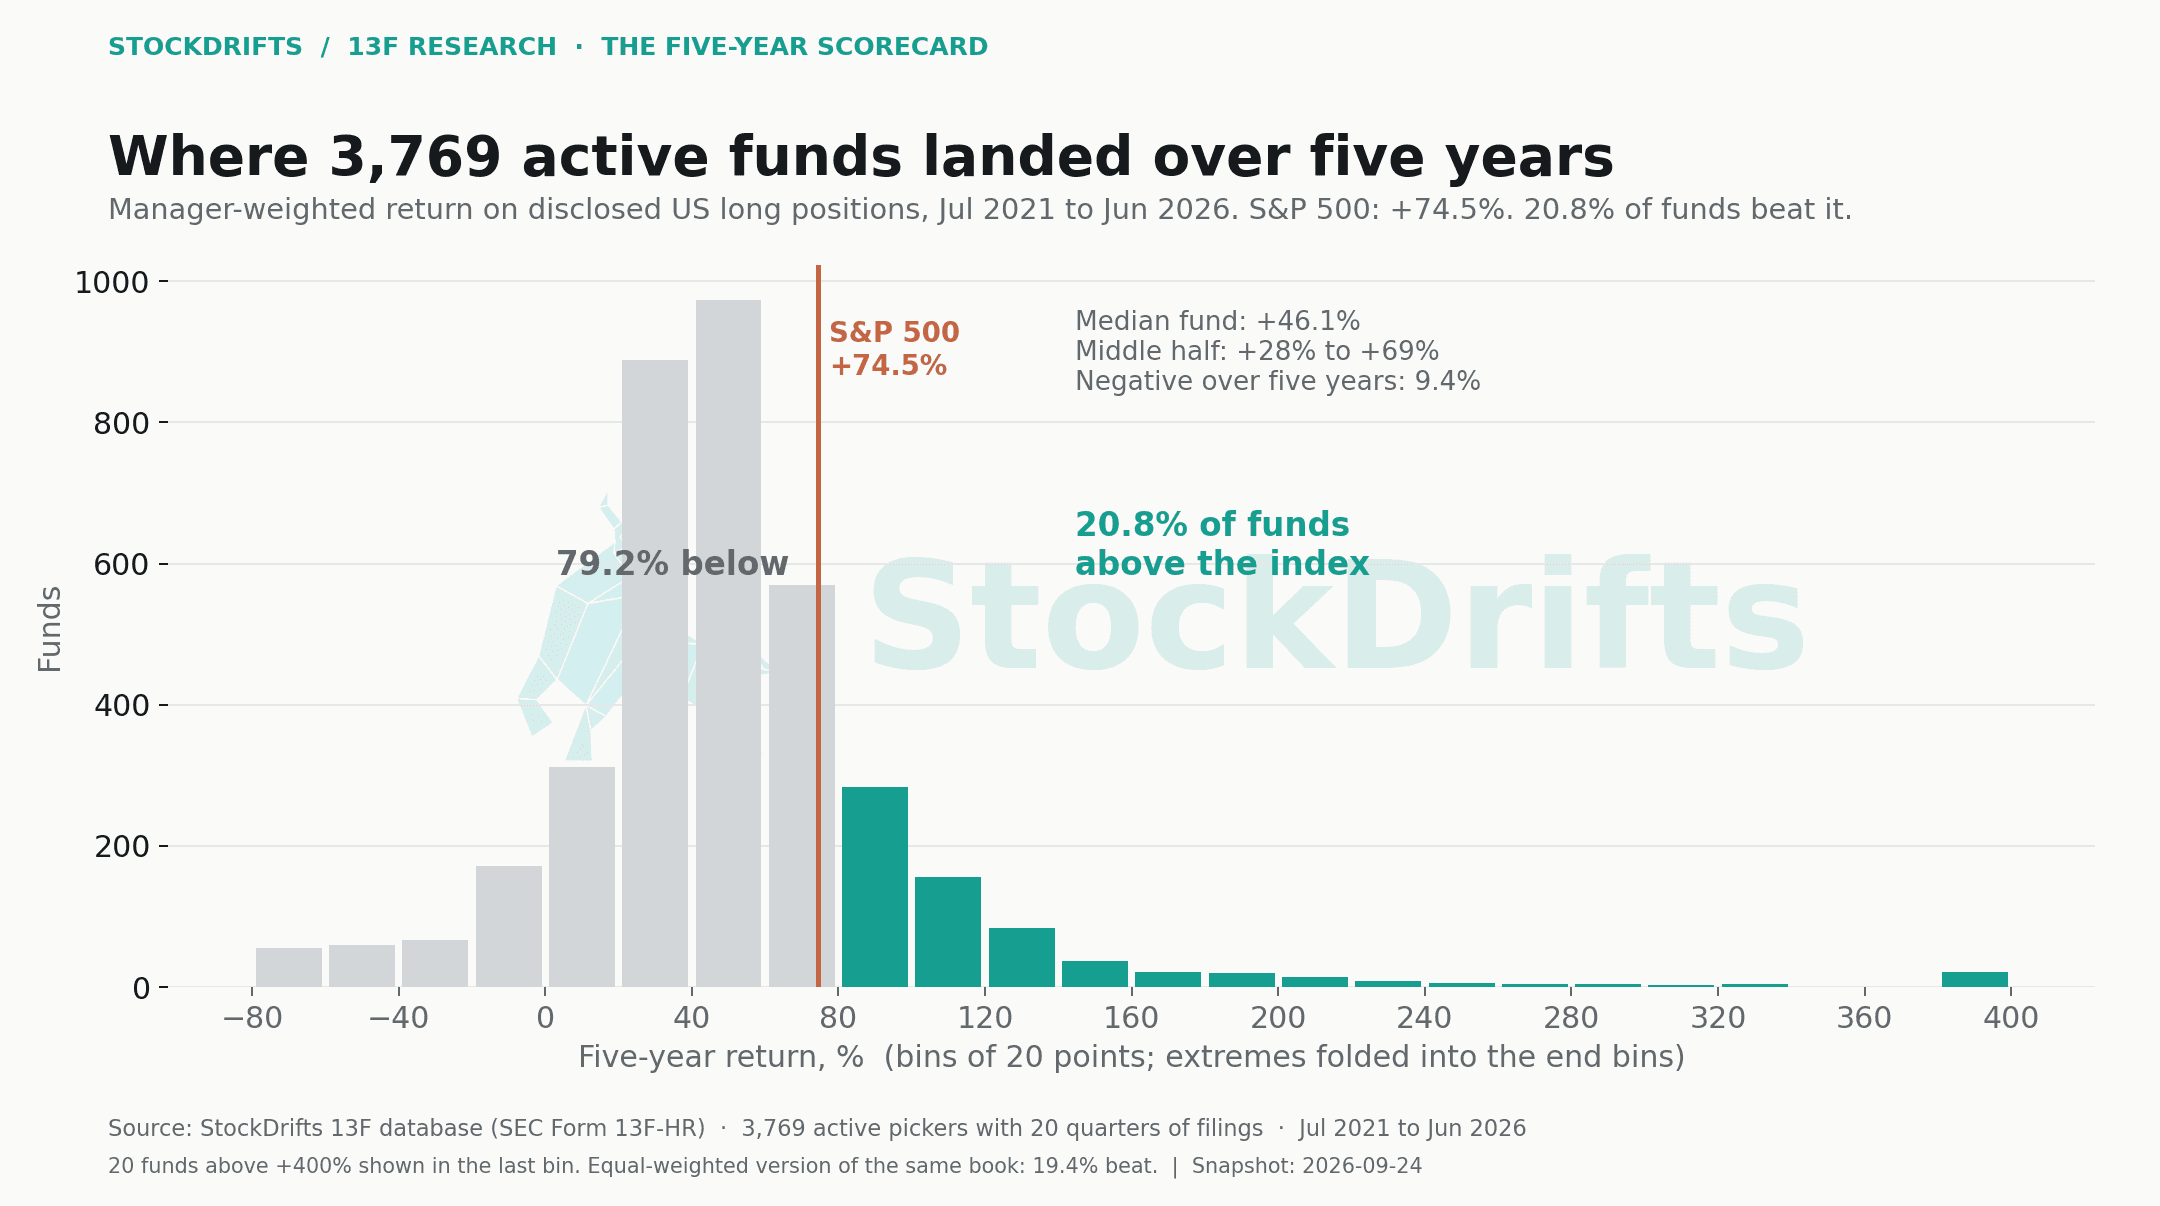
The question is simple: take every active 13F filer with five full years of history, compound the quarterly returns of the positions it disclosed, and compare the result with the S&P 500 over the same twenty quarters. The answer is that 20.8% of 3,769 funds beat the index and 79.2% did not.
The average is lower than the index too. The median fund returned +46.1% and the mean +60.8% against the index's +74.5%. The middle half of funds sits between +28% and +69%. The tails are long: the top tenth returned more than +101%, 20 funds returned more than +400%, and 9.4% of funds lost money over five years in which the index rose three quarters.
Weighting does not change the headline. If every fund had held its positions in equal size, 19.4% would have beaten the index instead of 20.8%. The picks and the sizing both trail the index for most funds.
02 / Three windows, one universe
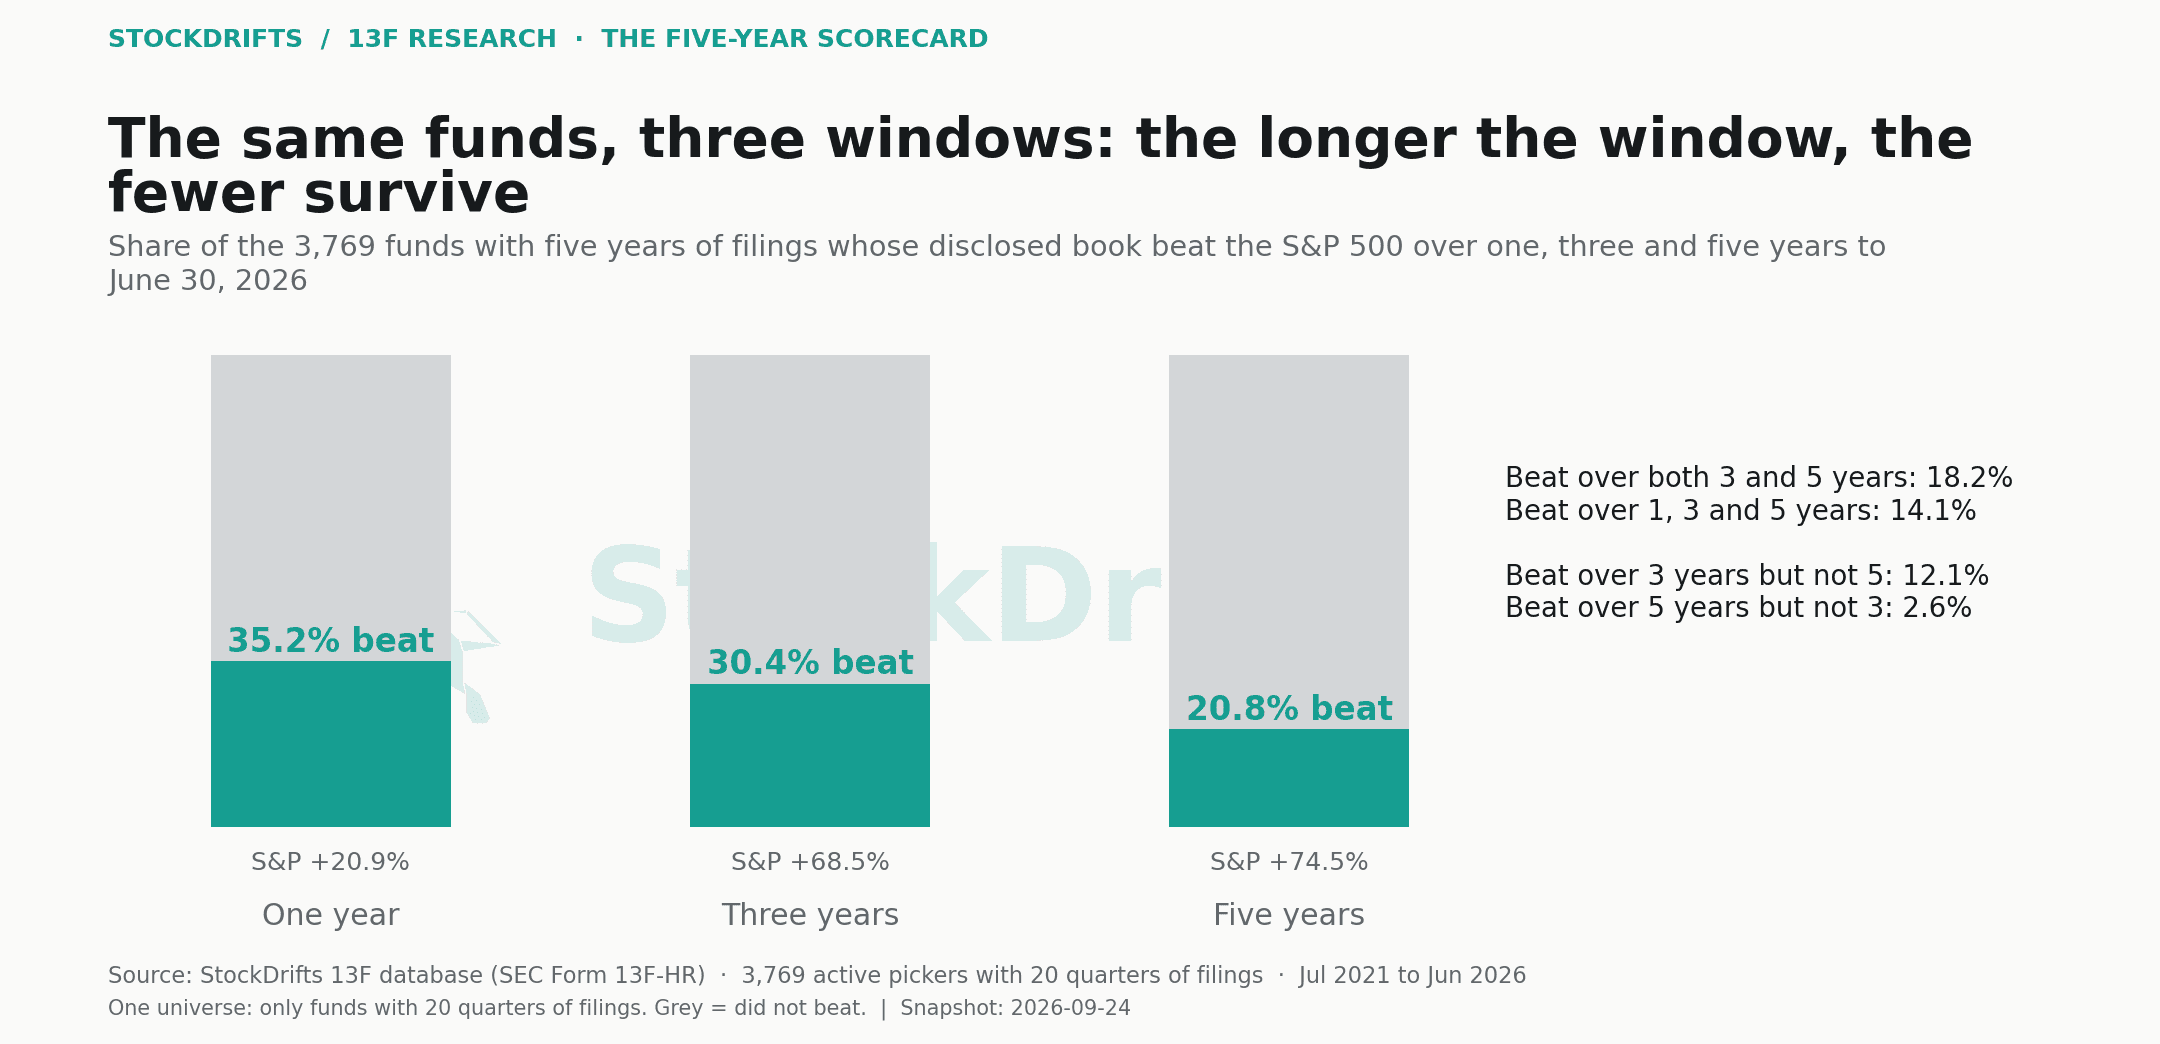
The longer the window, the fewer survive
Take only the 3,769 funds with five years of filings and score them over one, three and five years. Over the year to June 30, 2026, 35.2% beat the index (+20.9%). Over three years, 30.4% (index +68.5%). Over five, 20.8% (index +74.5%). Every extension of the window removes about a third of the survivors.
The direction of the leakage is one way. 12.1% of funds beat the index over three years but not over five; only 2.6% beat it over five but not three. 18.2% beat it over both, and 14.1% beat it over one, three and five years at once. A three-year record that starts in mid-2023 sees only the rally; the five-year record has to carry 2022 as well.
03 / The 2022 test
What the bear market did
Calendar 2022 is the quarter of the five-year window that separates it from the three-year one. The S&P 500 fell 9.3% that year. The median active fund's disclosed book fell 9.9%, 45% of funds beat the index during the year, and only 6.8% made money. Beating the index in a down year turned out to be a modest predictor of the full five years: 23% of the funds that beat the index in 2022 beat it over five years, against 19% of those that trailed in 2022.
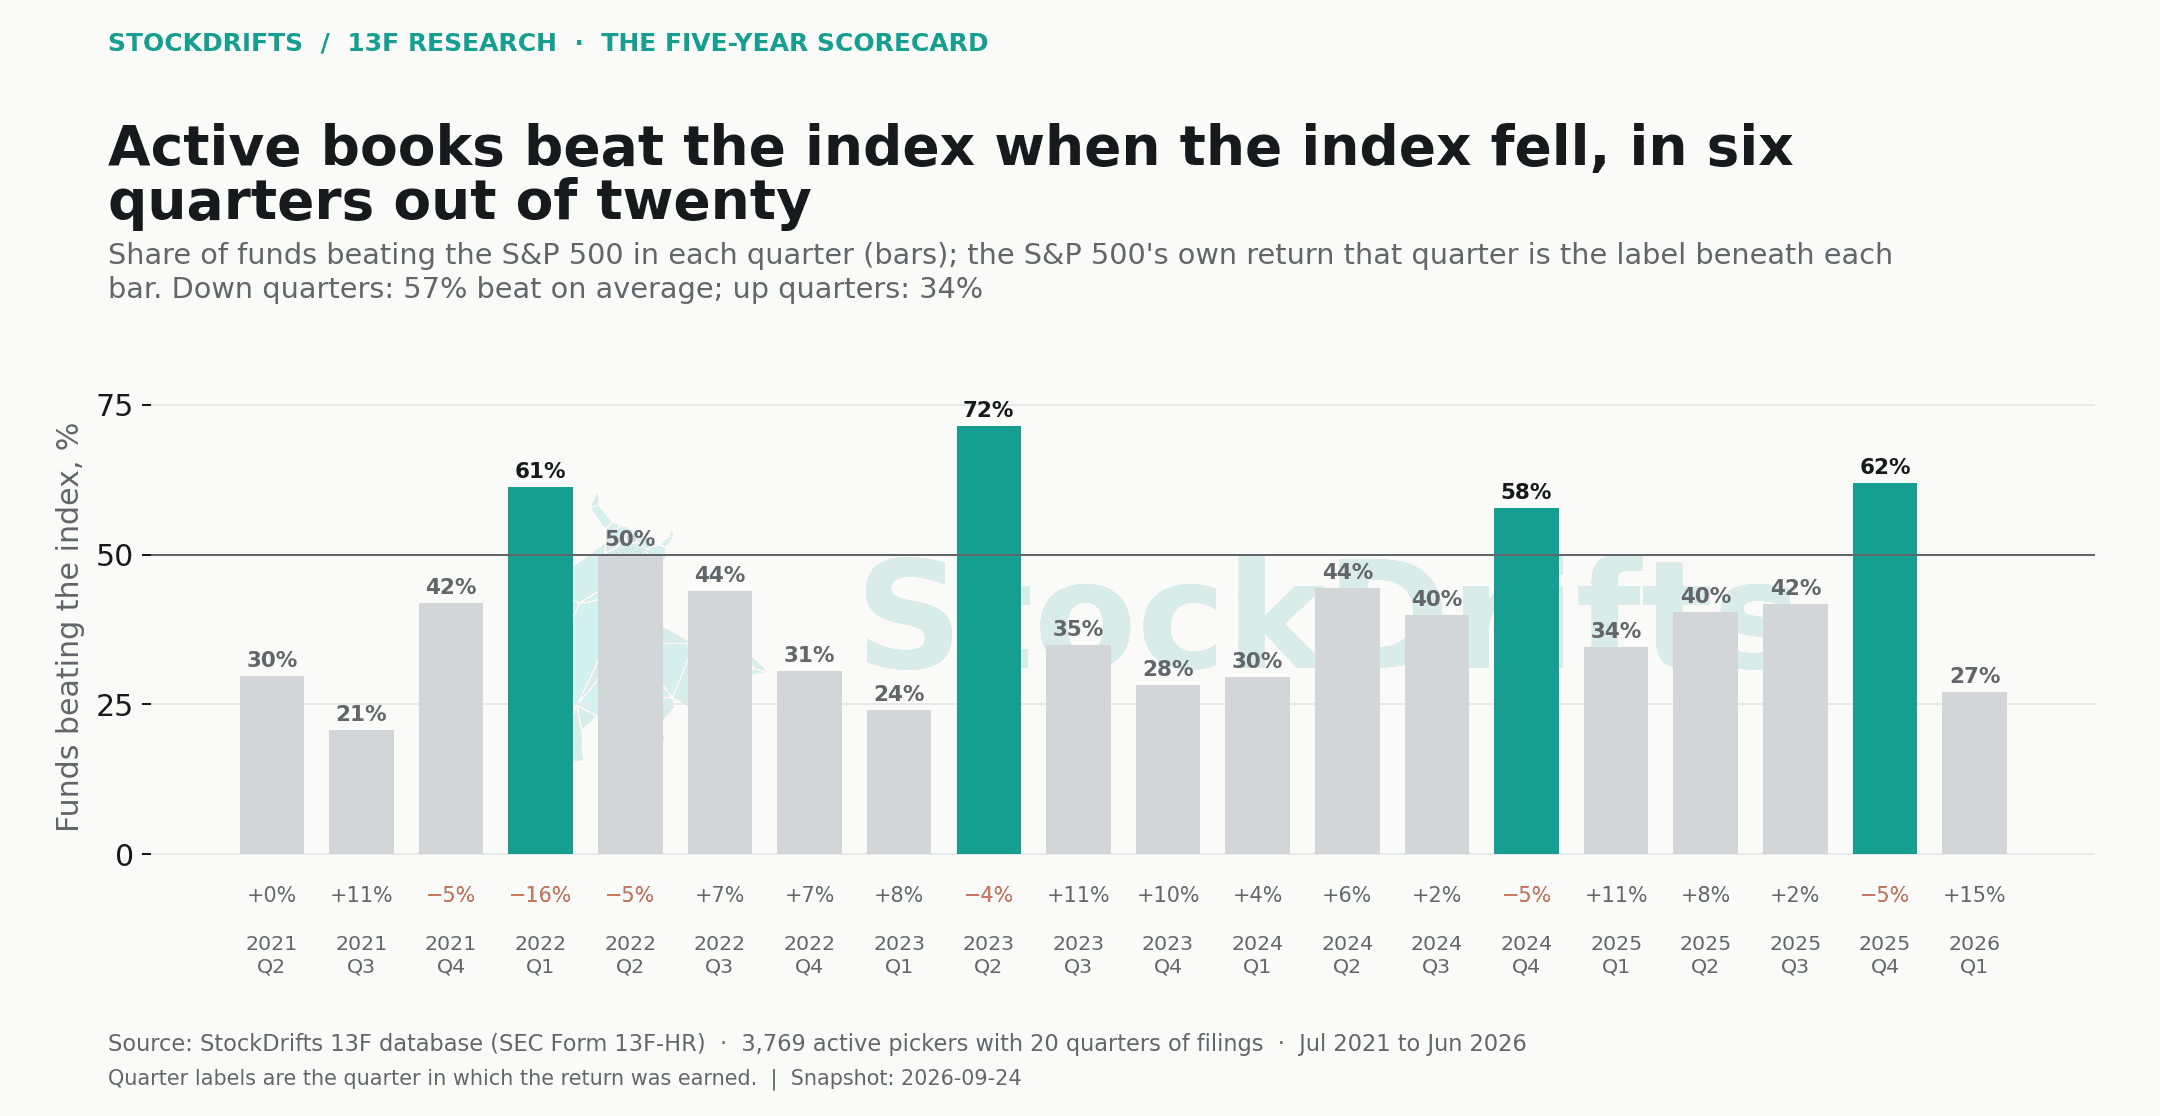
The quarter-by-quarter chart in section 9 shows the same pattern across all six down quarters of the window: active books win when the index falls and lose when it rises, and the index rose in fourteen of the twenty quarters.
04 / What the stars mean
A three-year rating, tested over five
StockDrifts' star rating is a percentile of the weighted three-year return, so over three years the rating and the result are the same thing: every fund rated three and a half stars or better beat the index, no fund rated two and a half or below did. Over five years the rating is being tested on eight quarters it did not see. 80% of five-star funds beat the index over five years, 80% of four-and-a-half-star funds, 68% of four-star funds, and the share falls to 22% at three stars and 1% at one. The median five-star fund returned +144% over five years, the median one-star fund +16%.
| Rating | Funds, 5y | Median 5y | Beat S&P, 5y | Funds, 3y | Median 3y | Beat S&P, 3y |
|---|---|---|---|---|---|---|
| 5★ | 200 | +144% | 80% | 262 | +179% | 100% |
| 4.5★ | 194 | +107% | 80% | 244 | +116% | 100% |
| 4★ | 184 | +91% | 68% | 231 | +96% | 100% |
| 3.5★ | 373 | +75% | 53% | 475 | +81% | 100% |
| 3★ | 364 | +64% | 22% | 475 | +68% | 48% |
| 2.5★ | 528 | +54% | 8% | 718 | +59% | 0% |
| 2★ | 545 | +44% | 2% | 736 | +50% | 0% |
| 1.5★ | 570 | +35% | 1% | 781 | +42% | 0% |
| 1★ | 811 | +16% | 1% | 1,082 | +27% | 0% |
05 / Size
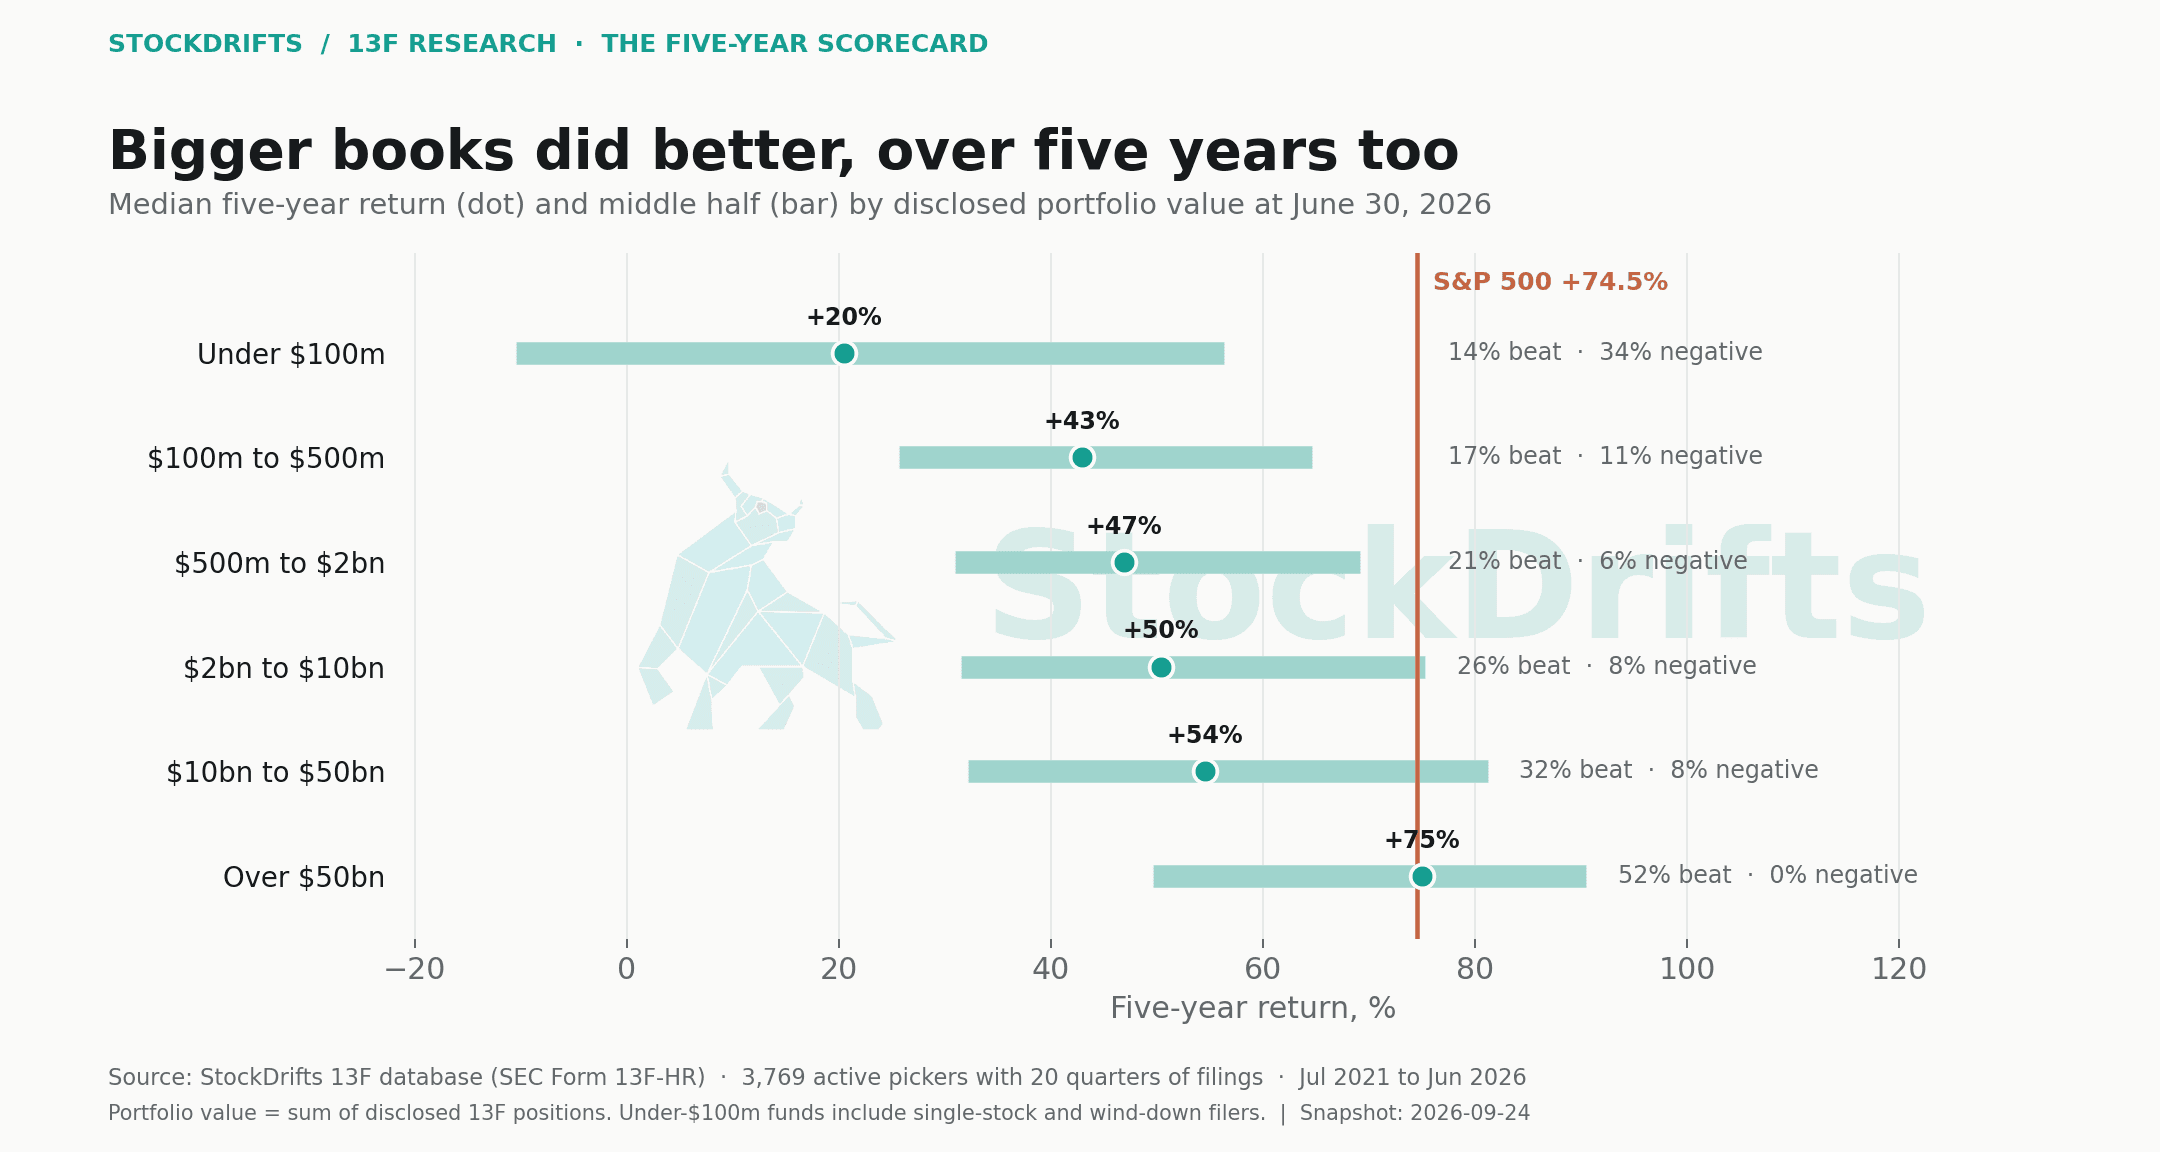
Bigger books did better
Sort the funds by the value of the positions they disclose and the median five-year return rises with every step. Funds under $100m: median +21%, 14% beat the index, 34% lost money. Funds between $2bn and $10bn: median +50%, 26% beat. Funds over $50bn: median +75%, 52% beat, none negative.
Two readings fit. The generous one is that scale buys research. The plainer one is that a window led by a handful of mega-cap stocks rewards the books that have to hold them; a $50bn fund cannot avoid Nvidia, Microsoft and Amazon, and a $100m fund can. The next study in this series, where the top funds are overweight, shows the top-rated funds hold 58% of their dollars in mega-caps against 41% for the bottom-rated.
Size and concentration together: funds over $1bn with a top-20 share under 50% had a median of +53% and 25% beat the index; funds under $1bn with a top-20 share over 50% had a median of +43% and 11% beat.
| Portfolio value | Funds | Median | 10th pct | 90th pct | Beat S&P | Negative |
|---|---|---|---|---|---|---|
| Under $100m | 154 | +20.5% | −51.4% | +88.1% | 14% | 34% |
| $100m to $500m | 1,374 | +42.9% | −1.2% | +91.9% | 17% | 11% |
| $500m to $2bn | 1,385 | +46.9% | +14.5% | +100.1% | 21% | 6% |
| $2bn to $10bn | 654 | +50.4% | +5.3% | +118.4% | 26% | 8% |
| $10bn to $50bn | 169 | +54.5% | +6.5% | +119.5% | 33% | 8% |
| Over $50bn | 33 | +75.0% | +12.4% | +112.0% | 52% | 0% |
06 / Number of holdings
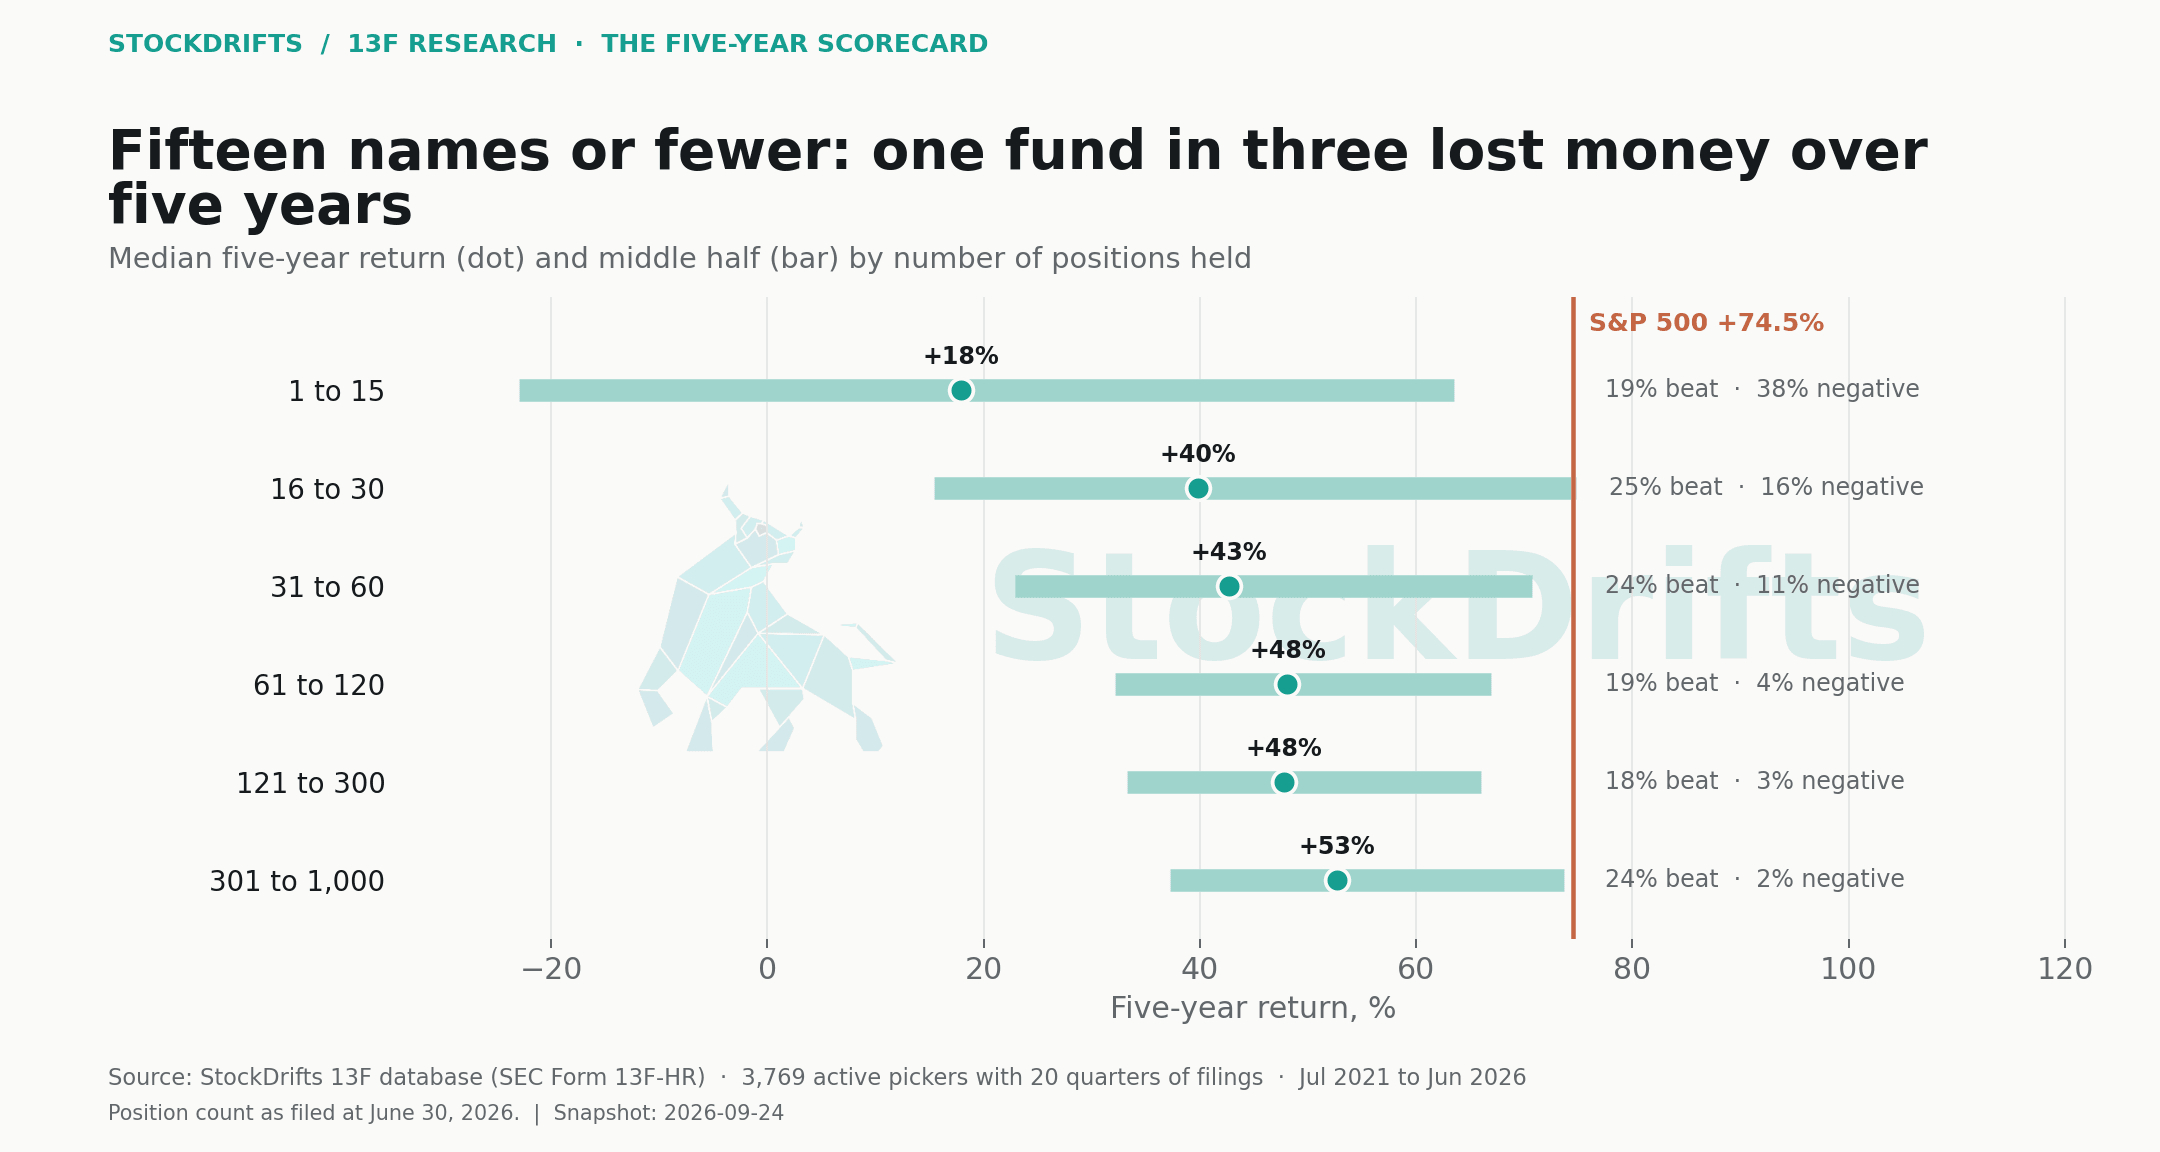
Fifteen names or fewer: one fund in three lost money
Funds holding 15 positions or fewer had the lowest median five-year return (+18%), the highest share of five-star records (18%) and by far the highest share of losses: 38% lost money over five years. Their bottom tenth returned −60% or worse; their top tenth more than +116%.
The 16-to-30 band had the highest beat rate (25%) and a median of +40%, but still 16% negative. From 61 positions upward the medians settle between +48% and +53%, and the share of negative funds drops below 4%. The widest books, 301 to 1,000 names, had the highest median of all at +53%.
07 / Concentration
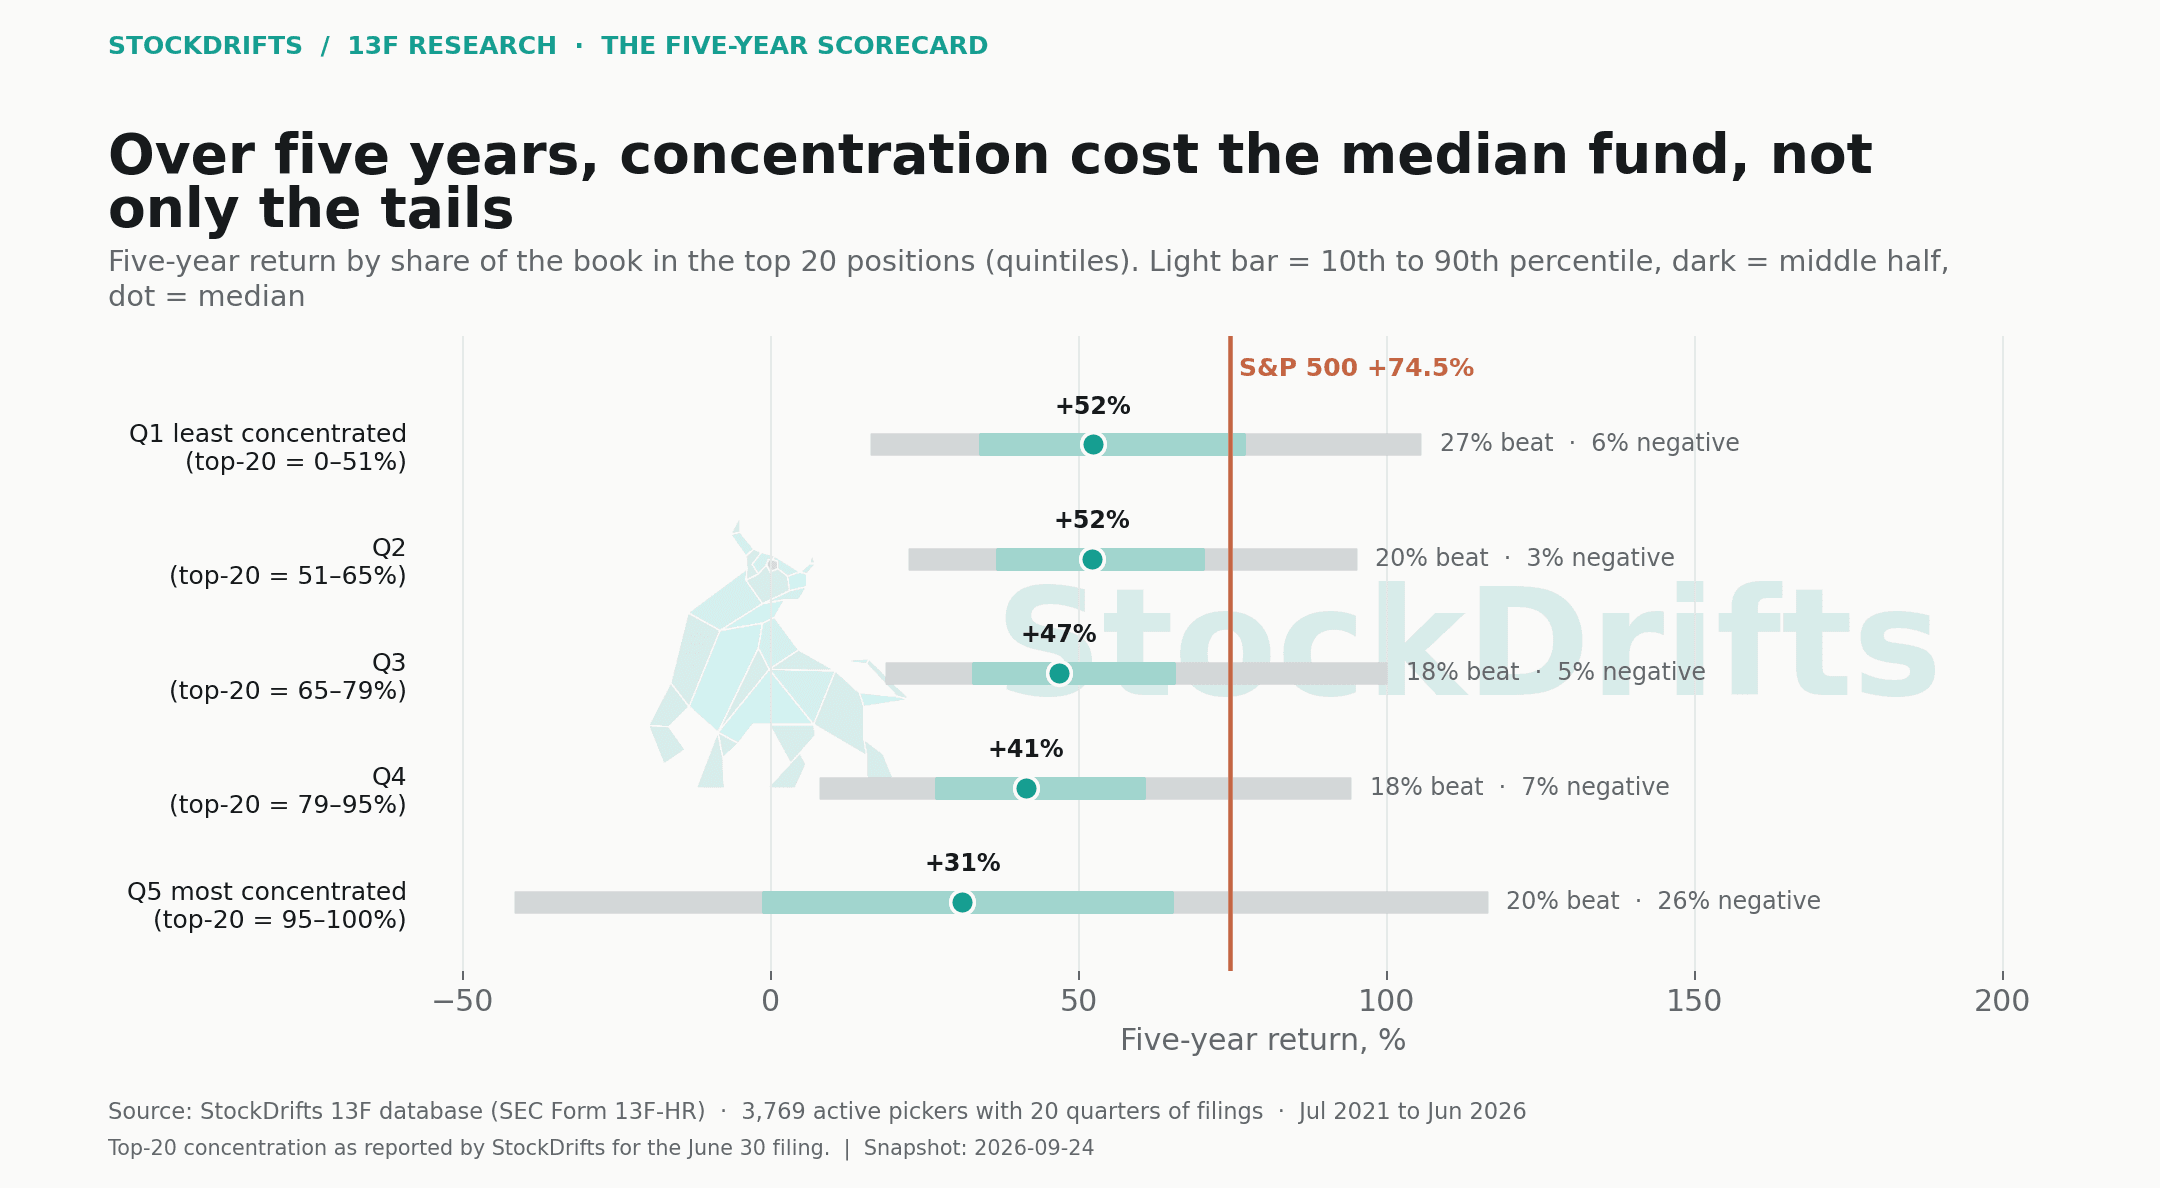
Over five years, concentration cost the median fund
Rank the funds by how much of the book sits in the top 20 positions and split them into fifths. Over three years the median barely moved with concentration; over five years it does. The least concentrated fifth returned a median +52% and 27% of it beat the index; the most concentrated fifth returned a median +31% and 20% beat. In the most concentrated fifth, 26% of funds lost money over five years, against 6% in the least concentrated, while its share of five-star records (16%) is still the highest of the five.
The 10th percentile falls from +16% in the least concentrated fifth to −42% in the most concentrated; the 90th percentile rises only from +106% to +116%. Over a window with a bear market in it, concentration bought more downside than upside.
08 / Picking versus sizing
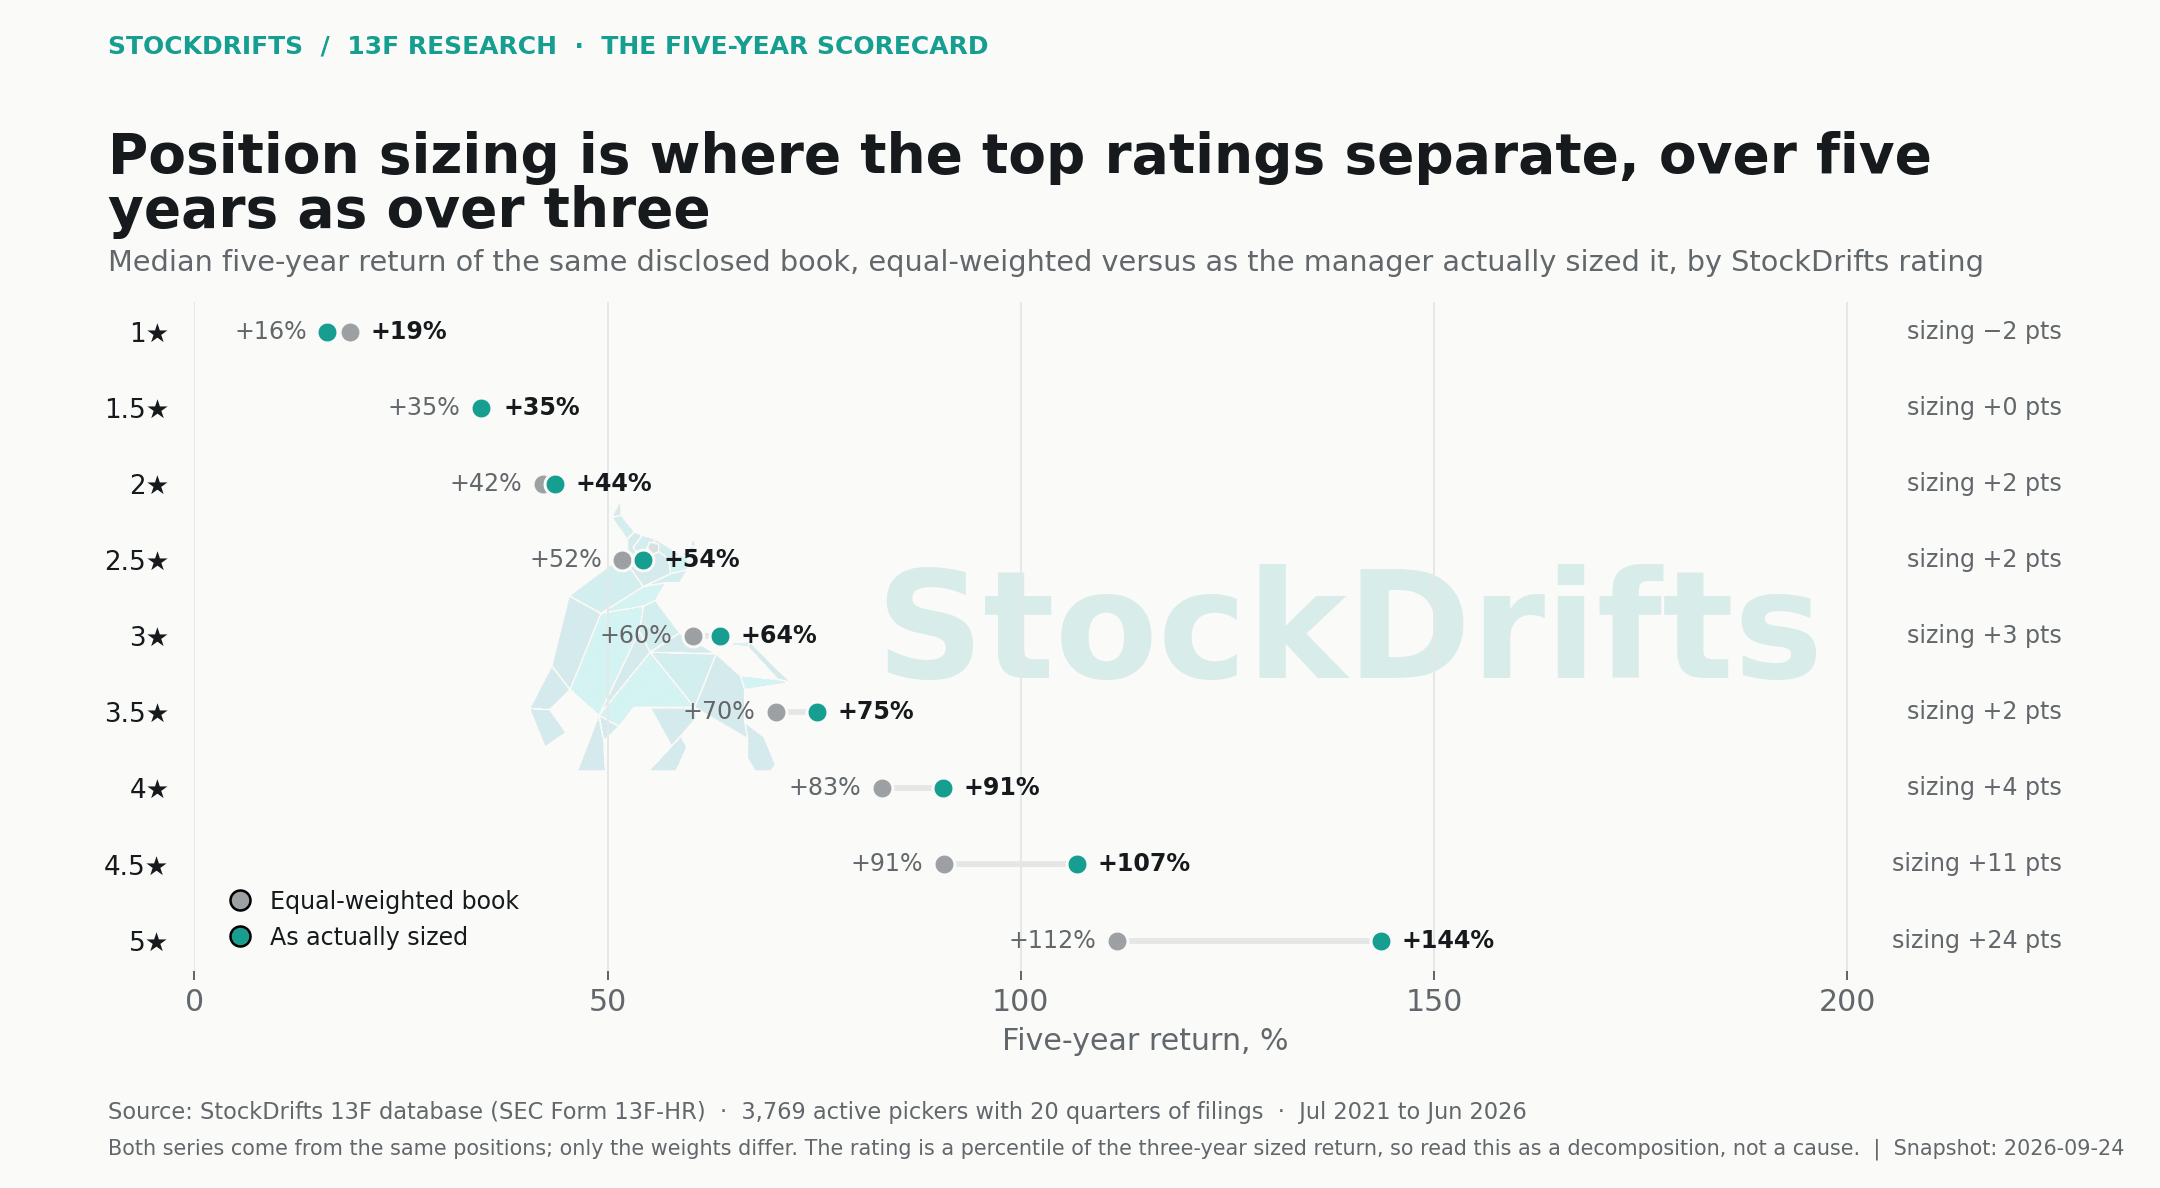
Position sizing is where the top ratings separate
Every fund's book can be scored two ways: as the manager sized it, and as if every position were the same size. The gap between the two is what sizing added. Across all 3,769 five-year funds the median gap is +1.2% points and sizing hurt 44% of funds. By rating, the gap runs in a straight line: one-star funds −1.9% points (sizing hurt 58% of them), three-star funds +3.2%, four-star funds +4.2%, four-and-a-half-star funds +10.9%, five-star funds +24.3% points, with sizing hurting only 24% of them.
Read this as a decomposition rather than a cause: the rating is a percentile of the sized three-year return, so funds whose largest positions happened to be their best positions are rated higher by construction. The five-year window softens that: eight of its twenty quarters were not in the rating, and the pattern holds. Among funds that beat the index over five years, sizing added a median +7.8% points; among funds that trailed it, +0.3%. At the index line, sizing changed the verdict for about one fund in ten: 3.9% of funds beat the index equal-weighted but not as sized, and 5.3% the reverse.
09 / Quarter by quarter
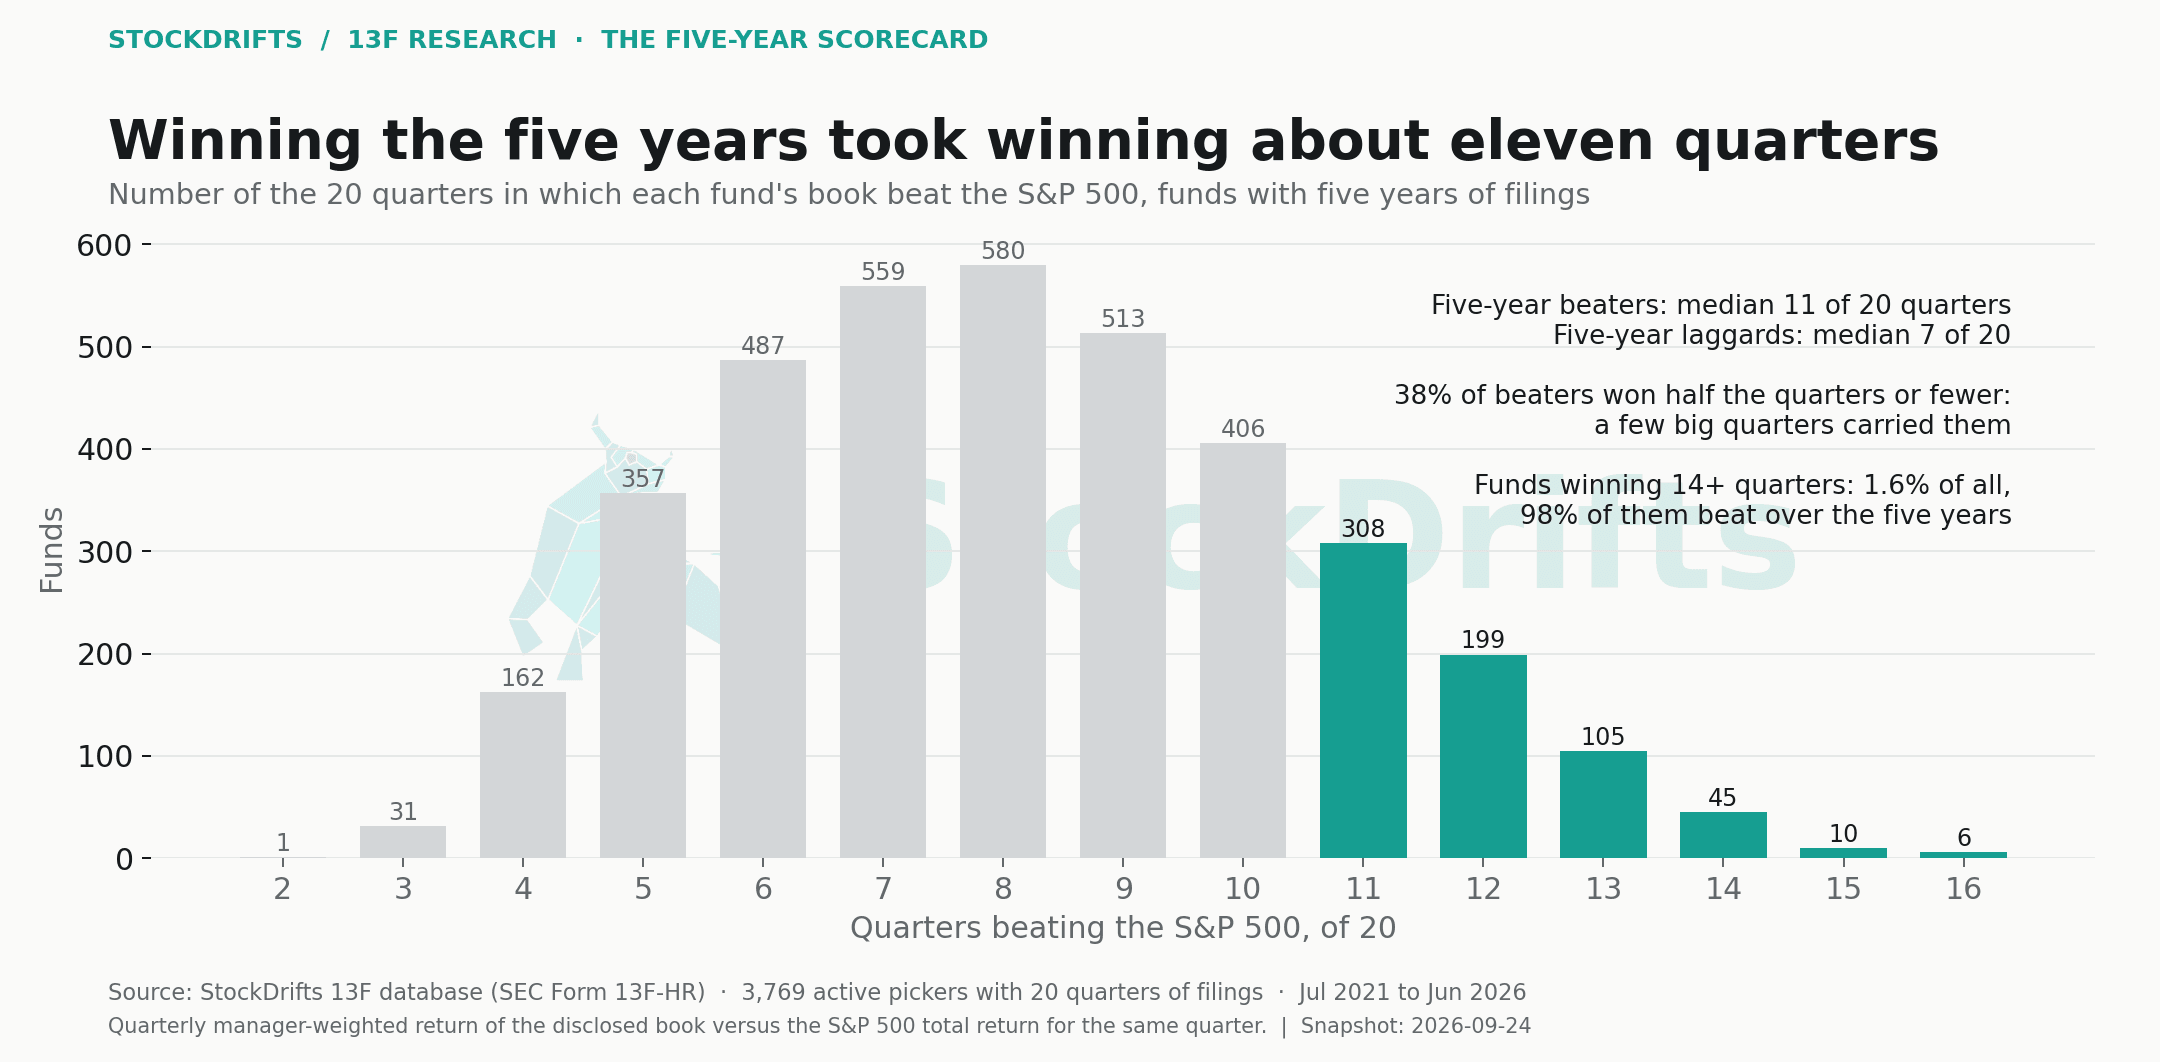
Winning the five years took winning about eleven quarters
Count the quarters in which each fund's book beat the index. Funds that beat it over the full five years won a median 11 of 20 quarters; funds that trailed won a median 7. Only 1.6% of funds won fourteen or more quarters, and 98% of those beat the index over the five years. At the other end, 28% of funds won six quarters or fewer.
The beaters were not all steady. 38% of the funds that beat the index over five years won half the quarters or fewer: they were carried by a few large quarters rather than by consistent outperformance.
The quarterly pattern also shows when active books win: when the index falls. In the six quarters in which the S&P 500 fell, an average of 57% of funds beat it; in the fourteen quarters in which it rose, 34%. The two quarters of the 2022 drawdown (Q1 and Q2) had 61% and 50% of funds ahead of the index; the two strongest quarters of the window, Q1 2026 (+14.9%) and Q3 2023 (+11.2%), had 27% and 35%.
10 / The best five-year records
Twenty-five funds, named
The strongest five-year records among funds with at least $250m disclosed, eight or more positions, and no single quarter above +150%. That last filter matters over five years: the raw leaderboard is topped by SPAC and convertible-arbitrage filers whose disclosed books show one quarter of several thousand percent when warrants or units re-price, which is an artifact of the filing rather than a return; 13 five-year funds are removed by it. The equal-weighted column is the same book with every position the same size, so a large gap means the fund's biggest positions were its best ones. Every name links to its StockDrifts investor page.
The list is led by FengHe, a Singapore manager of a US technology supply-chain book, Jeffrey Gendell's Tontine, and the semiconductor specialist Analog Century. Polar Capital is the largest book on the list at $42bn.
| Fund | Disclosed | Positions | 5y as sized | 5y equal-weighted | 3y | Quarters won, of 20 |
|---|---|---|---|---|---|---|
| FengHe Fund Management Pte. Ltd. | $1.1bn | 18 | +959% | +439% | +649% | 16 |
| Gendell Jeffrey L | $11.3bn | 103 | +903% | +210% | +709% | 14 |
| Analog Century Management LP | $2.7bn | 25 | +615% | +597% | +466% | 16 |
| Madison Avenue Partners LP | $2.3bn | 25 | +469% | +111% | +377% | 13 |
| DCF Advisers, LLC | $566m | 80 | +462% | +184% | +302% | 12 |
| WT Asset Management Ltd | $5.1bn | 29 | +402% | +158% | +460% | 13 |
| Brightline Capital Management LLC | $462m | 11 | +384% | +283% | +252% | 14 |
| Trivest Advisors Ltd | $3.2bn | 15 | +337% | +288% | +294% | 12 |
| Helikon Investments LTD | $3.3bn | 18 | +336% | +385% | +242% | 16 |
| Keywise Capital Management (hk) LTD | $734m | 12 | +326% | +267% | +335% | 14 |
| Polar Capital Holdings PLC | $42.4bn | 242 | +321% | +318% | +280% | 15 |
| Texas Yale Capital CORP | $4.6bn | 512 | +303% | +56% | +177% | 14 |
| Redwood Capital Management LLC | $927m | 25 | +300% | +98% | +360% | 10 |
| Oaktop Capital Management II L P | $2.4bn | 14 | +294% | +97% | +318% | 13 |
| Maple Rock Capital Partners INC | $5.1bn | 51 | +294% | +192% | +273% | 10 |
| Oak Grove Capital LLC | $2.1bn | 97 | +281% | +241% | +265% | 13 |
| Silver Point Capital L P | $1.1bn | 14 | +281% | +170% | +175% | 15 |
| Fairmount Funds Management LLC | $1.5bn | 12 | +275% | +295% | +293% | 10 |
| Glendon Capital Management LP | $773m | 26 | +271% | +91% | +147% | 14 |
| Shannon River Fund Management LLC | $1.1bn | 37 | +268% | +158% | +258% | 14 |
| Wolf Hill Capital Management LP | $1.2bn | 26 | +263% | +184% | +83% | 14 |
| Sailingstone Capital Partners LLC | $534m | 19 | +257% | +201% | +94% | 10 |
| Kopernik Global Investors LLC | $1.6bn | 26 | +253% | +227% | +170% | 13 |
| HERALD INVESTMENT MANAGEMENT Ltd | $737m | 92 | +247% | +116% | +270% | 12 |
| Slate Path Capital LP | $7.2bn | 40 | +246% | +229% | +304% | 11 |
11 / Explore the evidence
Every fund in the scorecard
Search all 5,251 funds in the universe. Returns are the manager-weighted return of the disclosed book to June 30, 2026 over five, three and one years; five-year figures are blank for funds with fewer than 20 quarters. The same table, with equal-weighted returns and the single-quarter flag, is in the CSV download.
Loading the table… · active funds with 12+ quarters · returns to June 30, 2026
| Fund | Rating | Disclosed | Positions | 5y | 3y | 3y equal-wt | 1y | Qtrs won / 12 |
|---|
Nothing matches these filters.
12 / Database coverage
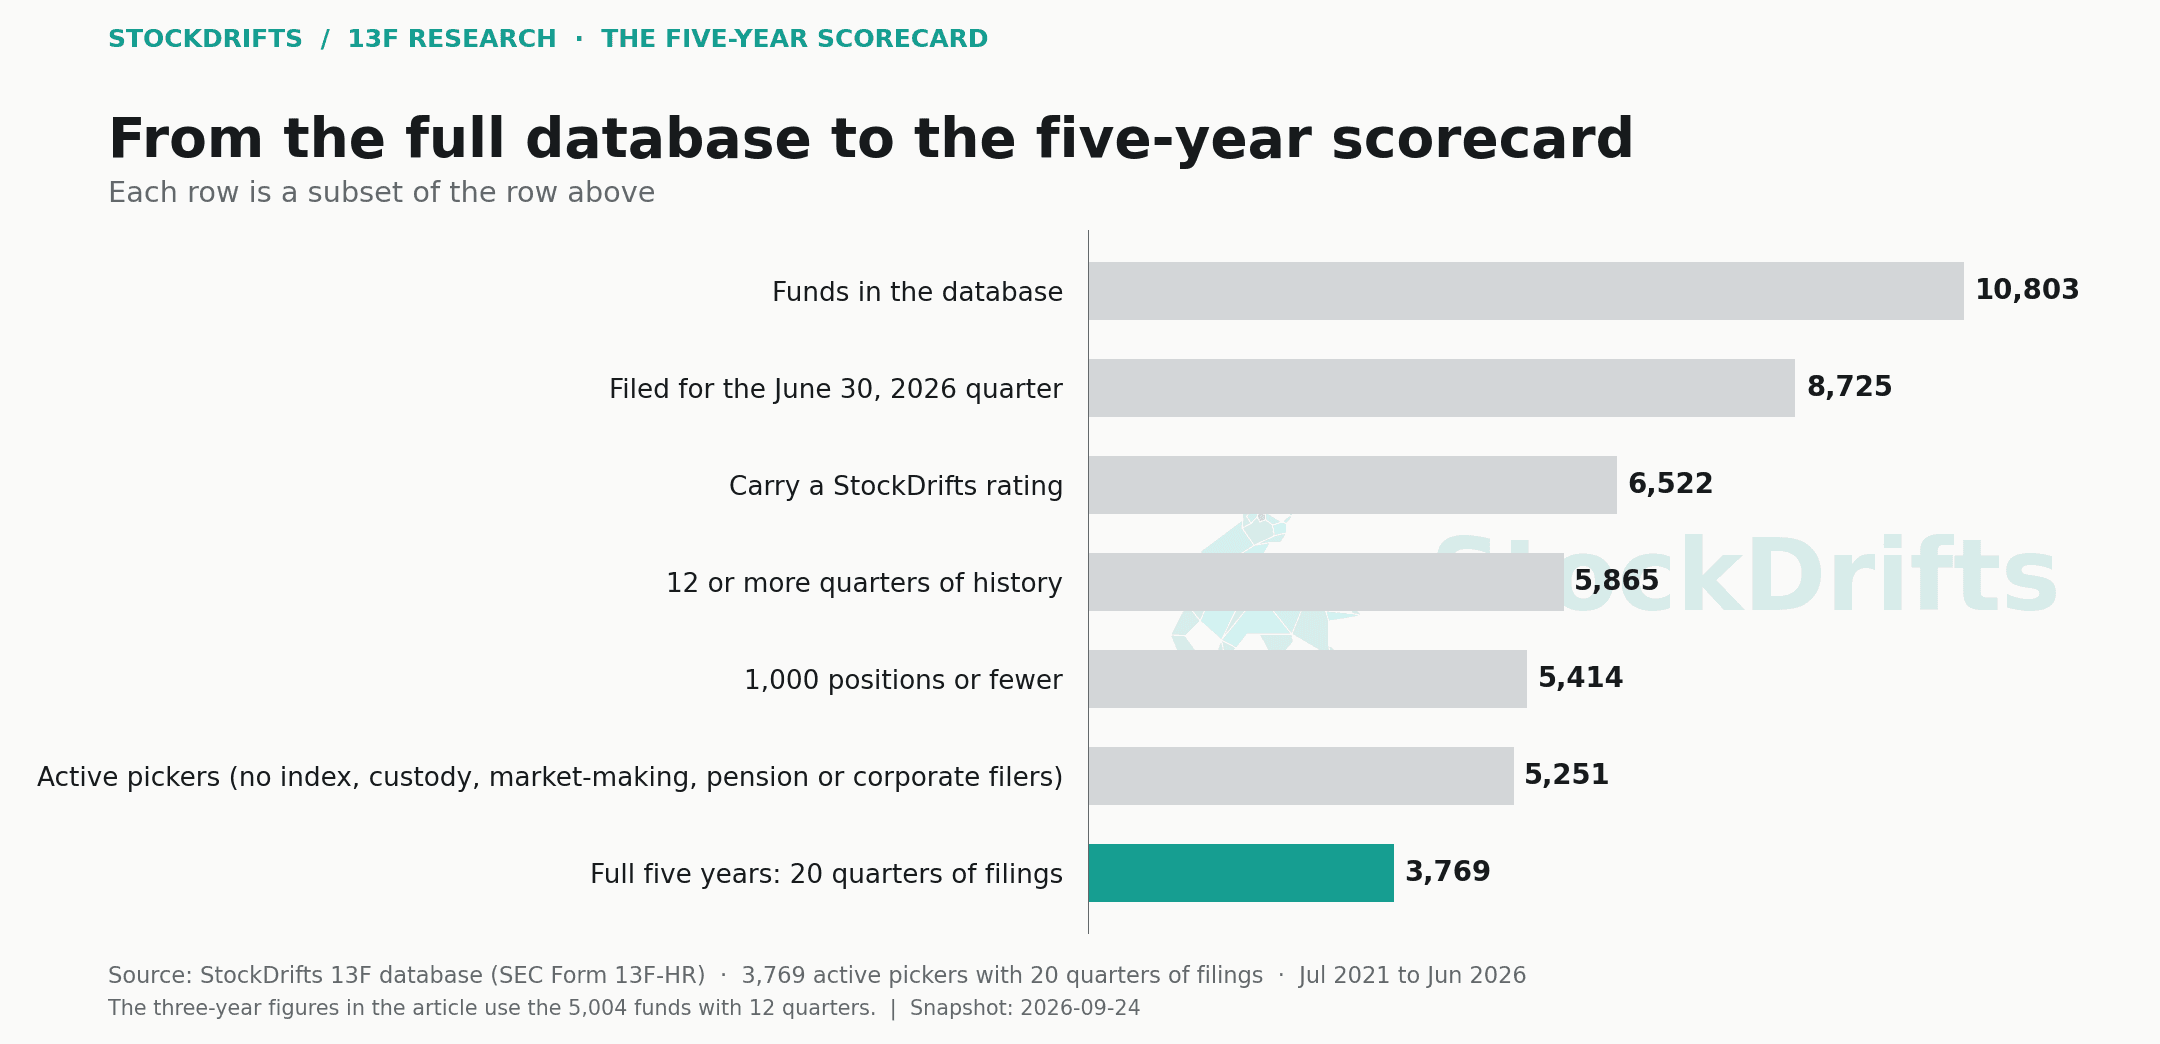
10,803 funds tracked, 3,769 with five years
- Funds tracked
- 10,803
- Every 13F filer in the database
- Filed for Q2 2026
- 8,725
- Filing dates July 1 to September 11
- Active pickers
- 5,251
- Rated, 12+ quarters, ≤1,000 positions, no index or custody filers
- With five full years
- 3,769
- 20 quarters of filings, July 2021 to June 2026
StockDrifts tracks 10,803 13F filers. 8,725 filed for the June 30, 2026 quarter. 6,522 carry a rating and 5,865 of those have at least 12 quarters of history behind it. Removing filers with more than 1,000 positions leaves 5,414; removing index managers, custodian banks, market makers, multi-manager quant platforms, pensions, insurers, sovereign funds and corporate holders leaves the 5,251 active pickers in this study. 3,769 of them have the full twenty quarters the five-year figures need; 5,004 have the twelve the three-year figures need. By rating group: 767 four- and five-star, 996 three- and three-and-a-half-star, 3,488 one- to two-and-a-half-star.
13 / Methodology & limitations
Exactly what went into this study
The return. For each fund and quarter, StockDrifts computes the return of the positions disclosed at the start of the quarter, weighted by their disclosed value (manager-weighted) and, separately, at equal weights. The windows chain those quarterly returns: twenty quarters to June 30, 2026 for five years, twelve for three, four for one. This is the return of a disclosed long book held for a quarter at a time, not the fund's NAV: it ignores fees, cash, shorts, options, non-US listings, intra-quarter trading and positions below the fund's top 50 in this database.
The benchmark. The S&P 500 total return over the same quarters, as carried in the StockDrifts database: +74.5% over five years, +68.5% over three, +20.9% over one. "Beat" means the fund's chained return exceeded the index's over the identical window. Calendar 2022 is the four quarters Q1 to Q4 2022, in which the index returned -9.3%.
The rating. One to five stars, a percentile of the weighted three-year return among rated filers. Five stars is roughly the top 4%. We require 12 quarters of history everywhere because the upstream calculation extrapolates shorter records to three years, which can turn a two-quarter run into a five-star score. The five-year figures require 20 quarters.
Single-quarter artifacts. 20 funds in the universe (13 with five years) show a single quarter above +150% in their disclosed-book series. These are SPAC sponsors, convertible-arbitrage and unit-holding filers whose warrants or units re-priced, not returns anyone earned on a long book. They are kept in the aggregate statistics, which use medians and beat rates, and excluded from the named tables; the CSV flags them.
Who is in. Q2 2026 filers with a rating, at least 12 quarters of filings, at most 1,000 positions, and no match on a list of index, custody, market-making, multi-manager, pension, insurance, sovereign and corporate filers. 5,251 funds; median disclosed value $0.4bn; median 100 positions. Named tables additionally require $250m disclosed and eight or more positions, and exclude venture, charitable, endowment and pension filers whose 13F is not a stock-picking record.
Size, holdings and concentration are as reported for the June 30, 2026 filing: the sum of disclosed positions, the number of positions, and the share of the book in the top 20. All three are end-of-window measures; a fund that grew because it performed well is counted at its larger size, and a fund whose winners grew into a concentrated book is counted as concentrated.
What 13F cannot show. Long positions in US-listed securities only. No short positions, no cash, no non-US listings, no derivatives. Filings arrive up to 45 days after quarter end. Funds that stopped filing before June 30, 2026 are not in the universe, so the scorecard carries survivorship: the funds that closed during five years that included a bear market are missing, and they are unlikely to have been the winners. The true share beating the index over five years is therefore, if anything, lower than 20.8%.
Sources. StockDrifts 13F database (SEC Form 13F-HR, all filers), snapshot September 24, 2026, filings through September 11, 2026. Scripts, intermediate tables and the summary file are published alongside this article.
14 / Questions
Questions this study answers
- Do hedge funds beat the market?
- Mostly not. Over the five years to June 30, 2026, 20.8% of 3,769 active 13F filers beat the S&P 500 with their disclosed US long book and 79.2% did not. Over three years 30.4% of the same funds beat it, over one year 35.2%. These are returns of disclosed long positions held a quarter at a time, before fees, not fund NAVs, so the true share is lower still once fees and closed funds are counted.
- What percentage of hedge funds beat the S&P 500?
- 20.8% over five years (3,769 funds, index +74.5%), 28.8% over three years (5,004 funds, index +68.5%), and 34.4% over one year. Only 14.1% beat the index over one, three and five years at once. Measured on the disclosed long books of active 13F filers, one to five stars, with at least 12 quarters of history.
- What is the average hedge fund return over five years?
- The median active 13F fund's disclosed book returned +46.1% over the five years to June 30, 2026 (mean +60.8%), against +74.5% for the S&P 500. The middle half returned between +28% and +69%; 9.4% lost money. Over three years the median was +53.2% against +68.5%. Published hedge-fund index returns are lower because they are net of fees and include hedged and non-equity strategies.
- Which are the best performing hedge funds over the last five years?
- Among investable funds (at least $250m disclosed, eight or more positions, no single quarter above +150%), the strongest five-year records to June 30, 2026 are FengHe Fund Management Pte. Ltd. (+959%), Gendell Jeffrey L (+903%), Analog Century Management LP (+615%), Madison Avenue Partners LP (+469%), DCF Advisers, LLC (+462%). The top 25 are in section 10 and every fund is in the table and CSV.
- Do bigger hedge funds perform better than small ones?
- In this window, yes. Funds with over $50bn disclosed had a median five-year return of +75% and 52% beat the index; funds under $100m had a median of +21%, 14% beat it and 34% lost money. Part of the gap is that large books have to hold the mega-cap stocks that led the market.
- Does a concentrated portfolio beat a diversified one?
- Not over these five years. The most concentrated fifth of funds had a median return of +31% and 26% lost money; the least concentrated fifth had a median of +52% and 6% lost money. Concentrated funds are, however, the most likely to hold a five-star record (16% of them): concentration buys both tails.
- How many hedge funds beat the S&P 500 five years in a row?
- 21 of the 3,769 funds with five years of filings beat the S&P 500 in each of the five years to June 30, 2026, against about 11 expected by chance; 194 beat it in four of five. The persistence study in this series has the full breakdown.
This study describes disclosed positions and their past returns. It is not a recommendation to buy or sell any security, and past returns of a disclosed book are not a forecast of a fund's future returns.
More in this series
- Does a top 13F track record persist? About a third of it doesOriginal Research · September 24, 2026
- Q2 2026: where the top-rated 13F funds are overweight, and where they are notOriginal Research · September 24, 2026
- What the best 13F funds are losing on, and what they are up eightfold onOriginal Research · September 24, 2026
- What the best 13F funds owned before the AI crash, and whether they saw it comingOriginal Research · September 24, 2026
- How StockDrifts rates 13F funds: the star rating, the universe and the limits of the dataMethodology · September 24, 2026